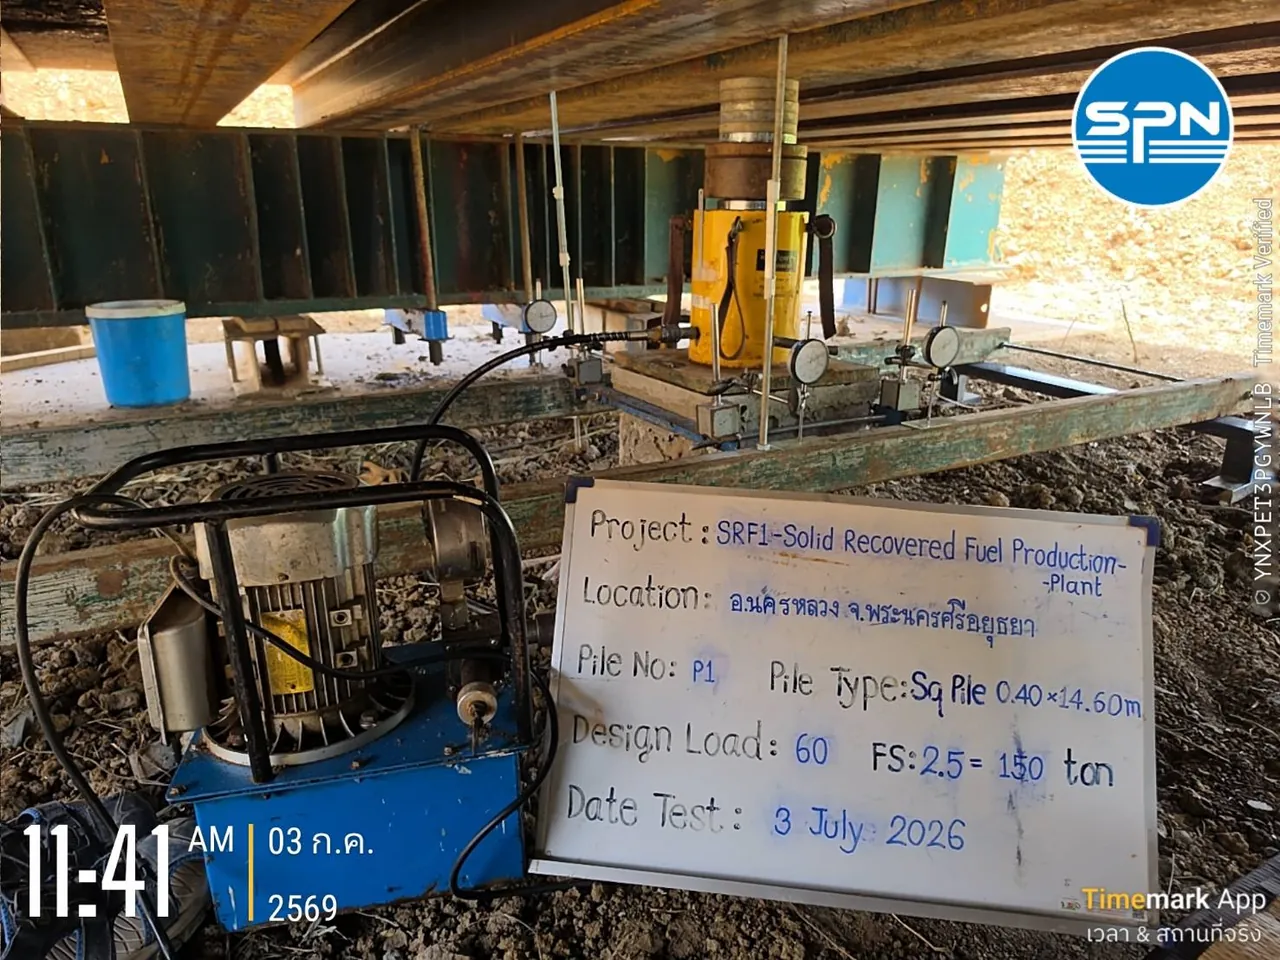
Which curves are used to read Static Load Test results?
Static Load Test results are read mainly from the Load-Settlement curve, supported by the Time-Settlement curve. Both come from applying real load to the pile head in increments up to the maximum test load in the spec, which is typically 2–3 times the design load, depending on each project's requirements.
Each load increment is held until the settlement meets the stability criterion, and the readings are recorded with dial gauges before the next increment is added. Once the maximum load is reached, the load is removed in steps and the rebound is measured. Testing and interpretation follow ASTM D1143/D1143M-20e1 and DPT 1251 (the static pile load test standard of the Department of Public Works and Town & Country Planning).
The result is a Load–Settlement–Time dataset, which is plotted as 2 main curves:
- Load-Settlement curve — load on the horizontal axis, settlement on the vertical axis; used for the main interpretation
- Time-Settlement curve — shows settlement versus time at each load increment; used to confirm that settlement has truly stabilized before more load is added

(For the test method and site preparation basics, see What is a Static Pile Load Test, and for an overview of all test methods, see The complete guide to pile testing methods)
What should you check on the Load-Settlement curve?
Reading Static Load Test results means checking 3 things together — gross settlement, residual settlement and the curve shape — not drawing a conclusion from a single settlement number. The table below summarizes what each one measures, the usual criterion and what it means when the criterion is exceeded.
← Scroll to see the full table →
| Item | What is measured | Typical criterion | Meaning if exceeded / abnormal |
|---|---|---|---|
| 1. Gross settlement Gross Settlement | Maximum pile-head settlement when the load reaches its maximum (mm) | Project-specific — the spec sets the allowable value based on pile size and test load | Gross settlement above the spec limit = test failed |
| 2. Residual settlement Residual Settlement | Permanent settlement remaining after all load is removed (mm) | Project-specific — a good pile should rebound a lot and leave little permanent settlement | Abnormally large permanent pile penetration; the cause must be investigated before the result is accepted |
| 3. Curve shape Curve Shape | Slope and continuity of the Load-Settlement curve at each load increment | Must not plunge steeply before the maximum test load is reached | Near-vertical drop = pile failure (geotechnical failure) |
1. Gross settlement at maximum load (Gross Settlement)
This is the maximum settlement when the load reaches its maximum. The project spec sets a clear allowable value; the figure varies by project and pile size, so always check your own spec. If the gross settlement exceeds the limit = failed.
2. Residual settlement after unloading (Residual Settlement)
After all load is removed, the pile head recovers partly (elastic rebound); the part that does not recover is the permanent settlement. This value tells you how far the pile has actually "sunk". A good pile should recover a lot and leave little permanent settlement.
3. Curve shape — signs of failure
The shape of the curve reflects how the pile carries load. The common patterns are:
← Scroll to see the full table →
| Load-Settlement curve pattern | Possible meaning |
|---|---|
| Gentle slope, gradual curvature; settlement increases slowly and stabilizes at every load increment | The pile carries load well and is still far from its ultimate capacity |
| The curve clearly steepens toward the end | The pile is approaching its ultimate capacity; check the criteria as well |
| Near-vertical drop (plunging) — a small load increase causes continuous settlement that does not stop | Pile failure (geotechnical failure); the soil can no longer carry the load |
| Abnormal settlement jump at one load increment | Possible problem with the pile structure or the test system; must be investigated |
The figure below draws all 4 patterns from the table so you can see their actual shapes, with what each one means and what to do next. Note the vertical dashed line, which represents the maximum test load: curve C plunges before reaching this line, so the pile is considered to have failed.
If your curve plunges or settles beyond the limit, see the investigation sequence and remedial options in Static Load Test failed: what to do

What is the Davisson Offset criterion and how is it used to find the ultimate capacity?
The Davisson Offset Method is the most widely used graphical criterion for estimating the ultimate capacity from a Load-Settlement curve. A line is drawn parallel to the PL/AE elastic compression line, shifted down by 4 + D/120 mm; the point where this line intersects the curve is the ultimate capacity.
This criterion is needed when the curve shows no clear failure, which is the case most of the time, because tests usually stop at 2–3 times the design load. There are 3 steps:
- Draw the Elastic Line — the elastic compression line of the pile itself, calculated from PL/AE = (load × length) ÷ (cross-sectional area × elastic modulus of the pile material)
- Shift that line down in parallel by Offset = 4 mm + (pile diameter D ÷ 120), with D and the result in millimeters (4 mm is the SI rounding of 0.15 in = 3.81 mm in Davisson's original)
- The point where the offset line intersects the Load-Settlement curve is the ultimate capacity by the Davisson criterion
From SPN's actual test result in the next figure — square pile SQ-400 (400 mm) → Offset = 4 + (400 ÷ 120) ≈ 7.3 mm, matching the position of the Davisson line drawn on the chart. The larger the pile, the further the offset line shifts down; for example, a 600 mm bored pile gives ≈ 9.0 mm.

If the curve runs to the end of the test without crossing the Davisson line at all, the ultimate capacity of the pile is higher than the maximum test load, which is a good result — the pile has more reserve capacity than the load tested.
Besides Davisson, some projects use other criteria such as the Chin Method, Mazurkiewicz or De Beer; the project spec will state which criterion applies.
Where does the measured settlement come from?
The settlement measured by the dial gauges at the pile head comes from 2 parts: elastic compression of the pile itself and movement of the pile in the soil. These must be separated before drawing conclusions.
- Elastic compression of the pile (Elastic Compression) — the concrete pile shortens under the applied load, like a very stiff spring. This part recovers when the load is removed and is not a problem; the longer the pile, the larger this part
- Movement of the pile in the soil (Pile Movement) — the pile actually moves down into the soil; this part tells you how the supporting soil behaves
A long pile with seemingly large gross settlement may simply have high elastic compression due to its length, not because the soil cannot carry the load. That is why reading gross settlement alone is not enough — always separate the components and check the rebound as well.
The 3D view below exaggerates the movement for clarity. The dashed line is the pile position before loading; the orange arrows show that the pile head moves down the most (the value S read by the dial gauge), while the pile toe moves down less (s). The difference is the compression of the pile itself — which is why the Davisson criterion starts from the PL/AE line before applying the offset.
Did the Static Load Test pass? A 6-point checklist
A pile passes when the test result meets all 6 points below. Check them in this order:
- Did the test load reach the maximum in the spec (e.g. 2 times the design load)?
- Is the gross settlement at maximum load ≤ the spec limit?
- Is the residual settlement after unloading ≤ the spec limit?
- The curve shows no plunging before the maximum load
- The curve does not cross the Davisson line (or, if it does, the resulting ultimate capacity ≥ the value required by the spec)
- The Time-Settlement curve at each load increment shows settlement stabilized before more load was added
Meeting all points = the pile passes the test criteria. However, the official conclusion must be made by an engineer, and final acceptance rests with the project's design engineer. To check whether a full report contains all the required information, see the pile test report checklist
Compare with how dynamic tests are interpreted in How to read PDA test results · Not sure whether to use a static or dynamic test? See Dynamic vs Static: which to choose · For budget and schedule planning, see Pile testing prices 2026 and How many days after casting can a pile be tested
Summary
Reading Static Load Test results requires checking 3 things together: gross settlement against the spec limit, residual settlement after unloading, and a curve shape that does not plunge. The ultimate capacity is estimated with the Davisson Offset criterion (the PL/AE line shifted down by 4 + D/120 mm), and you must distinguish which part of the settlement is elastic compression of the pile itself, which is not a problem.
A good report must present the Load-Settlement curve, the Time-Settlement curve and the analysis by the criteria required in the spec in full, with the conclusion made and certified by an engineer.
SPN Soil Engineering provides pile testing services including Static Load Tests to ASTM D1143/D1143M-20e1 and DPT 1251 nationwide across all 77 provinces of Thailand, with Load-Settlement curve reports and analysis by the criteria in the spec. Reports are certified by a licensed civil engineer registered with the Council of Engineers Thailand (COE) and can be submitted to the relevant authorities for building permit applications.