A Rebound Hammer can be picked up and fired within seconds, which is both its strength and its trap: what makes the numbers credible is the preparation and data handling, not the instrument itself. This article is a step-by-step field guide, from checking the hammer to writing the report. If you first want to understand the principle and limitations of the method, read What is the Rebound Hammer Test?
What needs to be prepared before firing the hammer?
Before the first impact, prepare four things: check the instrument, choose the hammer type, prepare the surface and check the condition of the concrete. This preparation stage has the greatest influence on how reliable the results are.
1. Check the hammer on the Test Anvil
The heart of a rebound hammer is its spring. With accumulated use the spring fatigues and readings drift. ASTM C805 requires the hammer to be checked on the standard steel anvil (Test Anvil) specified by the manufacturer before and after each use. If the anvil reading deviates from the value stated by the manufacturer, the hammer must be sent for readjustment first and the results must not be used.
2. Choose the hammer type to suit the member
Two main types of rebound hammer are in common use, differing in impact energy.
- Type N impact energy of approx. 2.207 N·m, used for ordinary concrete structures such as columns, beams, walls and foundations
- Type L impact energy of approx. 0.735 N·m, used for thin or small members where a Type N hammer delivers too much energy and makes the member vibrate
Readings from different hammer types cannot be compared directly. Always state the hammer type in the report.
3. Prepare the surface down to sound concrete
The rebound hammer reads the hardness of only about the first 30 mm of the surface, so whatever covers the surface becomes the reading. Plaster, paint, tiles or sand-cement screed must be chipped off to expose the concrete, which is then ground smooth with an abrasive stone. Rough surfaces, loose mortar or laitance should be ground off until the surface is dense and uniform, and the surface must be dry during testing.
4. Check concrete age and ambient conditions
Older concrete has a carbonated surface layer that is harder than the concrete inside, which can make R values significantly higher than the true value. For older buildings, carbonation depth should therefore be checked as well. In addition, the hammer and the concrete should be at similar temperatures, and the concrete must not be wet, because a damp surface gives readings lower than the true value.
How should test points be planned to meet the standard?
A test area is a defined zone in which several readings are taken and averaged into one representative value; it is not a single impact used to draw a conclusion. The main ASTM C805 requirements are summarized in the table.
← Scroll to see the full table →
| Item | Requirement | Reason |
|---|---|---|
| Test area size | Not less than 150 mm (diameter) | Room for 10 non-overlapping impact points |
| Readings per area | At least 10 readings | Reduces the effect of aggregate and voids below the surface |
| Spacing between impact points | Not less than 25 mm | Do not fire onto an earlier impact mark where the surface is already damaged |
| Member thickness | Not less than 100 mm and firmly fixed to the structure | Thin members vibrate and absorb energy, giving low readings |
| Reinforcement location | Do not fire directly over reinforcement with cover less than 20 mm | Shallow bars give rebound values that are too high |
| Impact direction | Must be the same direction to compare values, or apply the correction from the hammer manual | Gravity affects the rebound distance of the hammer |
Beyond the table above, field practice is to avoid the edges and corners of members, because their restraint differs from the interior and readings there are abnormal (ASTM C805 does not specify a numerical edge distance), and to avoid honeycombing, spalled surfaces or unusually porous concrete.
In practice, a grid sheet is held against the surface or a grid is drawn on it, and the points are given codes such as P1, P2, P6, so that the impact locations match those recorded in the report and the same points can be retested later.

6 steps for firing the hammer on site
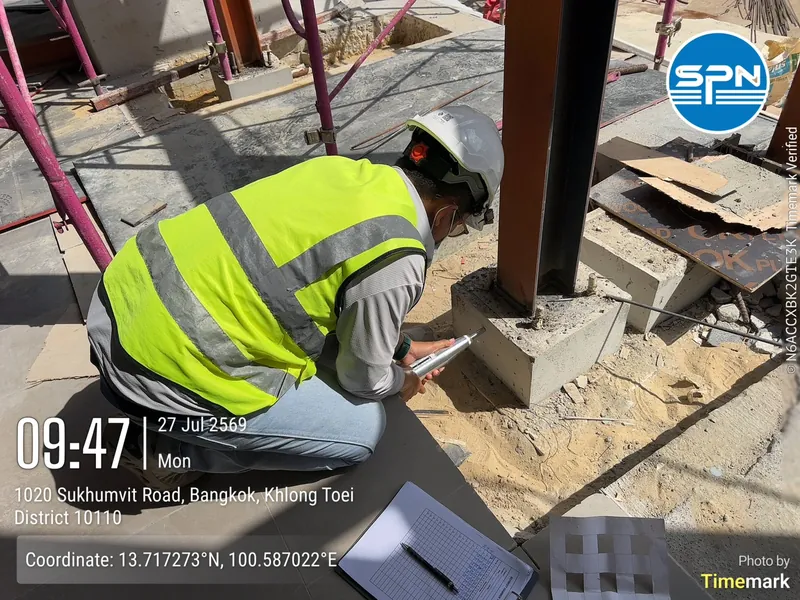
Correct firing means pressing the plunger perpendicular to the surface, applying steady pressure and recording every reading with its direction. The on-site sequence has 6 steps:
- Place the plunger perpendicular to the surface Set the plunger tip against the concrete at a right angle, not tilted, because an inclined impact sends energy in the wrong direction.
- Push the body toward the surface steadily Apply continuous, slow pressure until the spring releases the hammer by itself; do not jab or push quickly.
- Lock the pointer and read Press the lock button before pulling the hammer away, then read the Rebound Number on the scale and record each reading individually.
- Inspect the impact mark If the point crushes, cracks or hits a void, discard that reading immediately and fire at a new point.
- Fire until 10 readings are taken in the test area Move between points following the planned grid, at least 25 mm apart.
- Record the impact direction Horizontal, upward or downward must be stated every time, because gravity affects the reading and the correction from the hammer manual must be applied before values are compared.

How are outliers discarded? A worked example
ASTM C805 requires the average of the 10 readings to be calculated first; readings that differ from the average by more than 6 units are then discarded and the remaining readings re-averaged. If more than 2 readings differ by more than 6 units, the whole set is discarded and the test is repeated.
Example readings from one test area: 38, 40, 39, 41, 37, 40, 52, 39, 38, 40
- Initial average = 404 ÷ 10 = 40.4
- The value 52 differs from the average by 11.6 units, which exceeds 6 → discard (usually caused by hitting a large aggregate particle)
- The remaining 9 readings all differ from the average by no more than 6 → keep them all
- New average = 352 ÷ 9 ≈ 39.1 = the representative Rebound Number for this test area
This value of 39.1 must still be corrected for impact direction per the hammer manual before it is compared with other test areas or converted to compressive strength.
How do you calibrate R values to convert them to compressive strength?
Converting R to compressive strength requires a project-specific calibration curve built against Core Test results, not the curve supplied in the hammer manual. The manufacturer's curve is derived from one set of reference concrete whose mix, aggregate type, cement type and age may differ from the concrete under investigation, so the results can be well off. This is where most jobs go wrong.
A project-specific correlation, following the ACI 228.1R approach, is built as follows:
- Select test areas where cores can be drilled, spread to cover the expected range of strength (general practice recommends at least 6 data pairs)
- Carry out the Rebound Hammer test at that location first, following the steps above, then drill a Core Test per ASTM C42 at the same location
- Plot the data pairs (average R, core compressive strength) and fit a correlation line
- Use this correlation to convert R values for areas where no cores were drilled
A point that must always be stated in the report: ASTM C805 states that this method is not suitable as a basis for acceptance or rejection of concrete strength in place of cylinder testing per ASTM C39. Its proper role is to assess the uniformity of concrete in the structure, screen suspect areas and estimate compressive strength when supported by a calibration curve. For a comparison of the pros and cons of each method, see NDT vs Core Test: which to choose
Another popular approach is to combine the Rebound Hammer with the UPV Test per ASTM C597 (the SonReb method): the hammer reads surface hardness while UPV reads the density of the interior, so the two methods compensate for each other's limitations.
What should the test report include?
A traceable report must contain enough information for another engineer to repeat the work. The minimum items are:
- Hammer type and serial number (Type N or L), with Test Anvil check results before and after the work
- Layout of test areas with point codes, referenced to the structural drawings
- All 10 raw readings for each area, identifying discarded readings and the reasons
- Impact direction and the corrections applied
- Surface condition and preparation method, approximate concrete age, moisture and temperature conditions
- The method used to convert readings to compressive strength and the source of the calibration curve
- Limitations of the results, and conclusions certified by a civil engineer licensed by the Council of Engineers Thailand (COE), with signature and registration number
In Thailand, rebound hammer testing refers to DPT 1502-51, Rebound Hammer Testing, issued by the Department of Public Works and Town & Country Planning (DPT). It belongs to the same series as DPT 1501-51 (visual inspection), DPT 1504-51 (ultrasonic pulse velocity) and DPT 1505-51 (cover and reinforcement location). Citing both DPT and ASTM makes the report usable for both Thai designers and international consultants.
6 common mistakes on site
Most mistakes come from skipping preparation or incomplete data collection, not from the instrument.
- Firing on plaster or painted surfaces gives the hardness of the finish, not of the concrete
- Taking only 3–5 readings and averaging leaves too little data to reject outliers according to the criteria
- Not recording the impact direction makes it impossible to compare values between members
- Using the hammer manual's curve as the conclusion with no calibration against the actual concrete on that job
- Not checking the hammer on the Test Anvil so a fatigued spring lets readings drift unnoticed
- Firing close to column or beam edges gives abnormally low values that are misread as weak concrete
If the results come out below the design strength, do not draw conclusions from the hammer alone. For the next steps, see What to do when concrete compressive strength fails
Summary
A Rebound Hammer gives reliable results when the whole process is followed, not just firing and reading a number. The essentials are checking the hammer on the Test Anvil, exposing sound concrete, taking at least 10 readings per test area and discarding those that differ by more than 6 units, and calibrating against Core Tests on the same concrete before converting to compressive strength. All of this must be recorded in a traceable report.
SPN's non-destructive structural testing services cover Rebound Hammer, UPV, Core Test and rebar location. See the Non-Destructive Evaluation (NDE) page for details, and the price ranges at Structural testing prices. These prices do not include travel and equipment mobilization, which are charged extra depending on the distance to the site.