What Is the DCP Test?
DCP (Dynamic Cone Penetrometer) testing drives a steel cone into the ground by repeatedly dropping a hammer freely from a fixed height, then measures how far the cone penetrates per number of blows. The result is expressed in millimeters per blow (mm/blow), known as the DCP Index.
The DCP Index is converted to in-situ CBR (California Bearing Ratio) using the correlation equations specified in the standard, so the bearing capacity of a soil layer can be assessed without excavating samples for laboratory testing. This makes it widely used for pavement structures, factory floors and compaction quality control.
Stiff soil → little penetration → low DCP Index → high CBR | Soft soil → large penetration → high DCP Index → low CBR
Why Run a DCP Test? What Are the Benefits?
The main benefit of the DCP test is obtaining in-situ soil strength quickly, without taking samples to the laboratory. The benefits fall into four areas, summarized in the table:
← Scroll to see the full table →
| Benefit | Details |
|---|---|
| Estimate in-situ CBR | Can be used directly for pavement thickness design |
| Identify layers (strata) | Detects the thickness and interfaces of material layers with different strengths |
| Compaction quality control | Locates "soft spots" or under-compacted areas in fill |
| Fast and economical | Many points can be tested in a short time; portable equipment reaches remote sites |
In pavement quality control, the test team drives the DCP along a line of points in the QC plan. Points with an abnormally high DCP Index pinpoint soft spots beneath the pavement before the next layer is placed, as shown in the illustration below.
The CBR obtained from a DCP is field/in-situ CBR under the actual moisture and density conditions at the time of testing. It is not equal to the soaked CBR from the laboratory (where the specimen is soaked to saturation), so take care when comparing the two or using them as a design reference.
What Does DCP Equipment Consist Of?
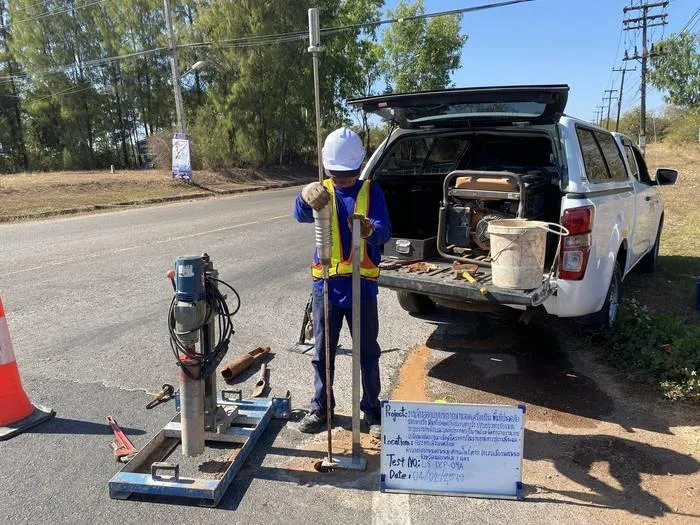
A standard DCP consists of an 8 kg hammer that slides and falls freely along a guide rod, transferring the blow to a steel drive rod with a 60° cone tip. The dimensions of each part are specified in ASTM D6951 as follows:
← Scroll to see the full table →
| Component | Specification (8-kg DCP) |
|---|---|
| Hammer | 8.0 kg (±0.010 kg) |
| Drop height | 575 mm (±1.0 mm) |
| Cone tip | 60° included angle (±1°), 20 mm base diameter (±0.25 mm) |
| Drive rod | 15.8 mm (5/8") diameter steel |
| Measuring scale | Readable to 1 mm |
In very soft soil, where the 8 kg hammer makes the cone penetrate too quickly, a 4.6 kg hammer can be used instead (keeping the same 575 mm drop height), but a Hammer Factor = 2 must be applied when calculating the DCP Index (the 8 kg hammer uses Factor = 1).
There are two cone tip types: the replaceable point, which requires an extraction jack to pull the rod out, and the disposable cone, held on with an O-ring, which detaches and stays in the ground when the rod is pulled out after testing, allowing faster extraction.
What Are the Steps of a DCP Test?
A DCP test has 6 main steps, from checking the equipment through to calculating the results. Each step has points to watch so the readings are not compromised, as summarized in the table:
← Scroll to see the full table →
| Step | What to do | Precautions |
|---|---|---|
| 1. Inspect the equipment | Check the couplers, handle, and wear of the rod and cone tip before starting the test | All joints must be tight — loose joints lose driving energy and distort readings |
| 2. Set the zero point | Place the cone so its widest part is level with the surface of the layer to be tested, then record the initial reading | Set the instrument plumb; any initial tilt increases as the rod is driven deeper |
| 3. Drive the cone | Raise the hammer until it lightly touches the handle, then let it fall freely from a height of 575 mm | Do not slam the hammer into the handle, and do not push or guide the hammer as it falls |
| 4. Record readings | Record the number of blows with the cumulative penetration (mm) — read every blow in soft soil, every 5 blows in normal soil and every 10 blows in very stiff soil | Read the scale to 1 mm; incomplete records make it impossible to separate the layers |
| 5. Stop at refusal | Stop the test when 5 blows advance the cone no more than 2 mm, or when the handle deviates more than 75 mm from vertical | Do not keep driving into a boulder or hard layer — move to a new point at least 300 mm away |
| 6. Extract and calculate | Withdraw the rod with an extraction jack (replaceable point) or by driving the hammer up against the handle (disposable cone), then calculate the DCP Index and convert it to CBR | With a disposable cone, the cone tip stays in the ground — this is normal for this type of equipment |
Typical test depth is about 1,000 mm (1 m). For ordinary road work, penetration of up to 900 mm is usually sufficient.
How Do You Calculate CBR from DCP?
The calculation has 2 steps: first determine the DCP Index from the field data, then convert it to CBR using the correlation equation for the soil type.
Step 1: Determine the DCP Index
5 blows, cone penetrates 25 mm with the 8 kg hammer → DCP Index = (25 ÷ 5) × 1 = 5 mm/blow
Step 2: Convert to CBR
ASTM D6951 (based on US Army Corps of Engineers equations) specifies 3 correlation equations by soil type:
Selecting the equation is a matter of engineering judgment — the soil classification must be known first. If the wrong equation is used, the CBR will be significantly in error.
DCP Index vs CBR Correlation Table
← Scroll to see the full table →
| DCP Index (mm/blow) | CBR (%) | Strength level |
|---|---|---|
| < 3 | 100 | Very stiff |
| 5 | 50 | Stiff |
| 7 | 35 | Good |
| 10–11 | 20 | Medium |
| 20–21 | 10 | Fair |
| 30–34 | 6 | Soft |
| 65–66 | 2.7 | Very soft |
| > 324 | < 0.5 | Extremely soft |
Table abridged from ASTM D6951 Table 2 (general equation) — use as preliminary guidance only; actual values should be calculated with the equation appropriate to the soil type.
How Do You Interpret Soil Layers from a DCP Plot?
Layer analysis means reading the slope of the DCP plot to separate material layers of different strength. When cumulative penetration (vertical axis) is plotted against cumulative blows (horizontal axis), and the soil has several layers of different strength, the slope of the plot changes at each layer interface:
- Steep slope = fast penetration = soft soil
- Shallow slope = slow penetration = stiff soil
The thickness of each layer is found from the intersection of the lines representing the average slopes of adjacent layers. The average DCP Index and CBR of each layer are then calculated separately.
The figure below places the DCP on the pavement layers next to a plot drawn on the same depth scale. The slope of the plot changes exactly at each layer interface; the steeper segments are the weaker layers.
Base layer: 150 mm in 30 blows = 5 mm/blow → CBR ≈ 48% · Subbase: 200 mm in 20 blows = 10 mm/blow → CBR ≈ 22% · Subgrade: 450 mm in 15 blows = 30 mm/blow → CBR ≈ 6% (calculated from CBR = 292/DCP1.12) — the layer with the lowest CBR is the one the designer must focus on, and a location with abnormally low values compared with neighboring points signals a soft spot.
Example of Actual DCP Test Results
The example below is a DCP test report from an actual SPN project (test point LS-DCP-9A), tested from the ground surface to a depth of 2.0 m. The report shows the number of blows, DCP Index and in-situ CBR for each depth interval, with a CBR–depth plot that shows soft and stiff layers in a single view.
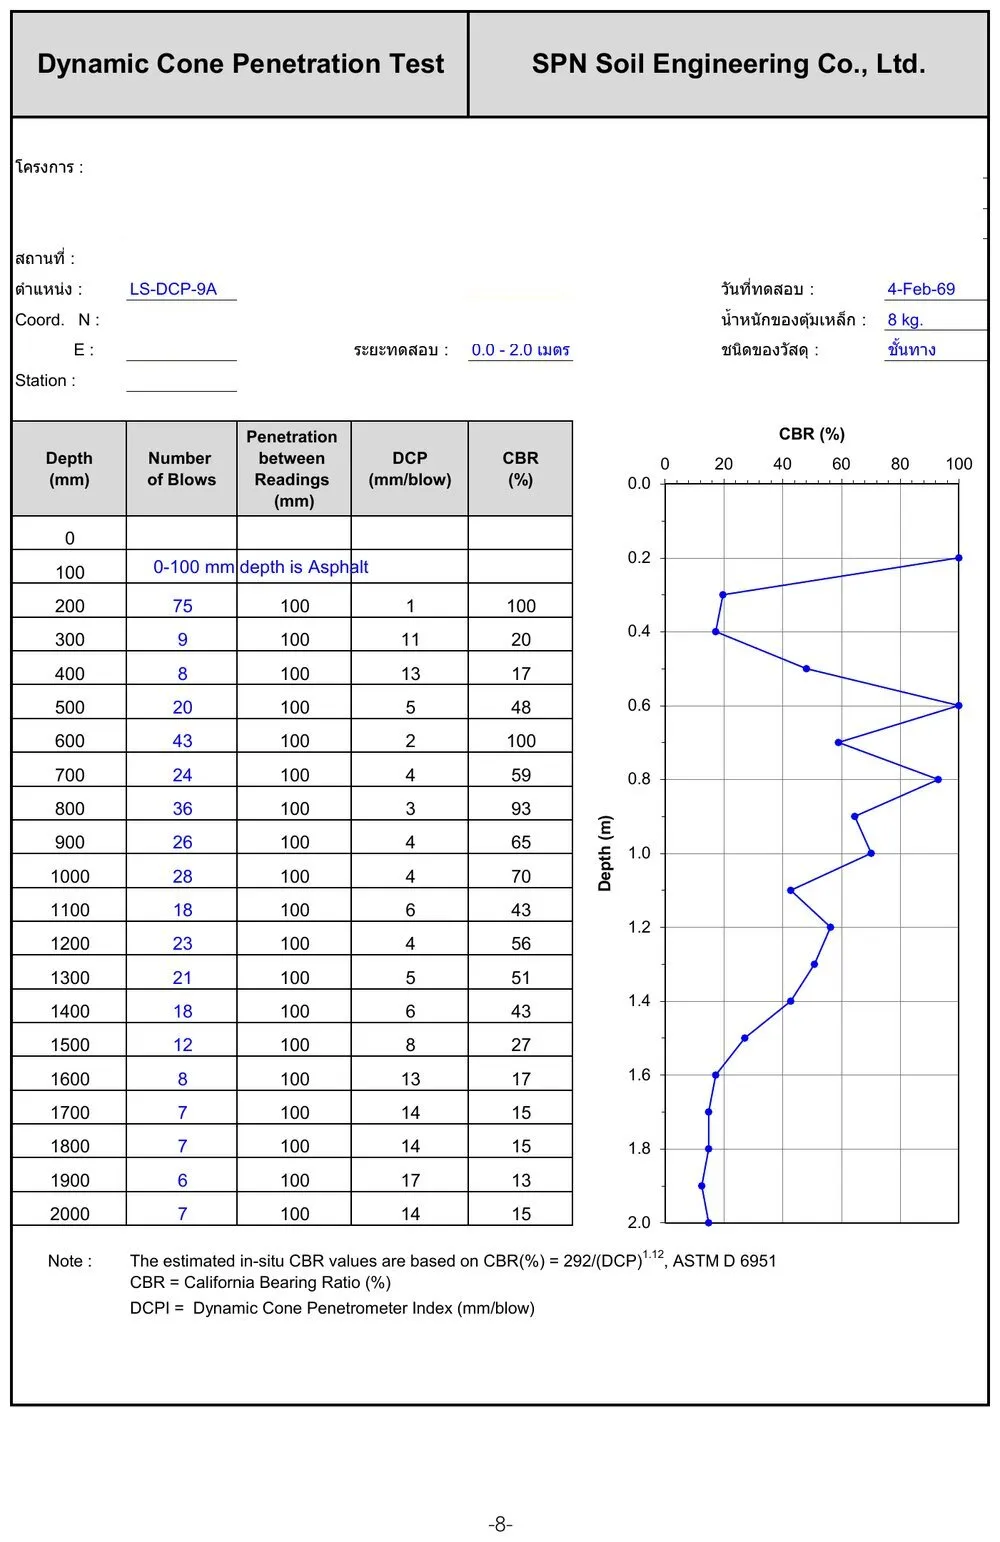
Note that the top interval (0–100 mm) is an asphalt layer, followed by compacted material with high CBR, alternating with intervals where the value decreases with depth. Plotting CBR against depth like this lets engineers identify the thickness and strength of each layer accurately for pavement structure design.
What Are the Limitations of the DCP?
The main limitations of the DCP relate to the types of material it can test and its limited depth. They can be grouped into "not suitable" and "well suited" as follows:
Highly stabilized or cemented materials, and coarse granular materials with a large proportion of stones larger than 50 mm (2 in.)
Fine-grained and coarse-grained soils, granular construction materials, and weakly stabilized materials
To test layers beneath a hard layer, such as under a bound pavement surface, an access hole must first be drilled or cored, leaving about 10–20 mm of the hard layer, and the DCP is then driven through the remainder.
Which Standard Does the DCP Test Follow?
The main standard for the DCP test is ASTM D6951, which covers the equipment specifications, procedure and CBR correlation equations:
- ASTM D6951 / D6951M-18 — Standard Test Method for Use of the Dynamic Cone Penetrometer in Shallow Pavement Applications (first issued in 2003 · the -18 edition was reapproved in 2023)
- The CBR–DCP equations are based on research by the US Army Corps of Engineers (Webster et al., 1992 / 1994)
DCP repeatability is a standard deviation of less than 2 mm/blow in coarse granular materials, making it a relatively reliable field test.
How Is the DCP Used with Other Tests?
The DCP mainly provides strength data for the shallow zone, so it is often combined with other tests to provide complete data for design and quality control:
- DCP vs KPT vs SPT — comparing three probing methods and choosing the right one for the job
- Field Density Test — verifies % compaction against the specification; used with the DCP, which checks the uniformity of strength
- Plate Bearing Test — determines the bearing capacity and modulus of subgrade reaction (k) of compacted layers
- Soil investigation + SPT — deep soil profile data for foundation and pile design
This article is provided as engineering knowledge. The choice of test method, number of points and interpretation of results should follow the project requirements and the judgment of a licensed engineer.