What Is a Field Density Test?

A Field Density Test, or in-place soil density test, determines the density of soil that has been compacted in the field and compares it with the Maximum Dry Density from a laboratory compaction test (Proctor Test). The result is the Degree of Compaction (% Compaction), the key indicator used to “accept” compacted earthwork against the specification.

It is one of the most important quality control (QC) tests in earthwork, used for embankments, roads, concrete yards, fill under foundations, factory floors and backfill behind retaining walls.

Field Density Test by the Sand Cone method to determine the density of compacted soil in the field, by the SPN engineering team
Field Density Test by the Sand Cone Method — the hole volume is measured with standard sand to calculate the density of the compacted soil (Photo: SPN Soil Engineering)

Why Test the Density of Compacted Soil?

Soil that is not compacted densely enough contains many air voids, resulting in large settlement, low bearing capacity and high permeability, which lead to wavy or cracked roads, sinking floors and foundation damage. Density testing confirms the quality of compaction before structures are placed on top, across roads, highways, bridges, buildings and dams.

How Is Percent Compaction Calculated?

The core of a Field Density Test is finding the in-place “dry density” and comparing it with the maximum from the Proctor test, using only a few key formulas:

Wet density:   ρ = M / V M = mass of wet soil excavated from the hole, V = volume of the test hole
Hole volume (Sand Cone):   V = Msand / ρsand From the mass of standard sand filling the hole, divided by the calibrated density of the sand
Dry density:   ρd = ρ / ( 1 + w ) w = soil moisture content (as a decimal) — removes the effect of water so the result can be compared correctly with the Proctor
Percent compaction:   R = ( ρd,field / ρd,max ) × 100% ρd,max = maximum dry density from the laboratory Proctor test
✅ Worked example (hypothetical values)

Standard sand poured into the hole 1,500 g, sand density 1.50 g/cm³ → V = 1,000 cm³ · wet soil excavated 2,000 g → ρ = 2.00 g/cm³ · moisture 12% → ρd = 2.00 / 1.12 = 1.79 g/cm³ · Proctor gives ρd,max = 1.85 g/cm³ → R ≈ 96.5%, passing the 95% criterion — if the wrong ρd,max is used (e.g. Standard and Modified swapped), this figure changes immediately

What Test Methods and Standards Are Used?

There are several methods for measuring in-place density; the Sand Cone is the most widely used reference method:

← Scroll to see the full table →

Method / StandardHow it works
Sand Cone (ASTM D1556 / AASHTO T191)Uses standard sand to measure the hole volume; the most widely used reference method, high accuracy, suitable for coarse- to fine-grained soils
Nuclear Density Gauge (ASTM D6938)Measures density and moisture quickly in the field using radiation; requires calibration and a radiation license
Rubber Balloon (ASTM D2167)Uses a water-filled rubber balloon to measure the hole volume, similar in principle to the Sand Cone — ASTM withdrew this standard in 2024, so new work generally uses the Sand Cone or Nuclear method instead
Drive/Core Cutter (ASTM D2937)A steel cylinder is driven in to take a fixed-volume sample; suitable for fine-grained clay without gravel
Proctor (ASTM D698 / D1557)Laboratory test to determine maximum dry density (Standard/Modified), used as the reference for % compaction

Note: work in Thailand usually references ASTM/AASHTO standards together with the specifications of the Department of Highways (DOH) and the Department of Public Works and Town & Country Planning (DPT). Check the latest editions before use.

Diagram of Sand Cone Method apparatus showing the sand jar, standard cone, base plate and test hole, with standard dimensions per ASTM D1556
Sand Cone apparatus diagram — a jar of standard sand attached to a cone, placed on a base plate over the test hole; the hole volume is found from the mass of sand that fills it. As shown, the standard cone is about 136.5 mm high, the base is about 165–171 mm wide, and the test hole is about 10 cm deep (actual dimensions may be adjusted to the soil particle size per ASTM D1556) — Diagram: SPN Soil Engineering
Laboratory Proctor compaction test (ASTM D698/D1557) — soil placed in a mold in layers and compacted to find the maximum dry density, used as the reference for % compaction, by the SPN team
Laboratory Proctor (Compaction) Test — determines the maximum dry density (ρd,max) used as the reference for calculating the percent compaction in a Field Density Test (Photo: SPN Soil Engineering)

What Are the Steps of a Sand Cone Test?
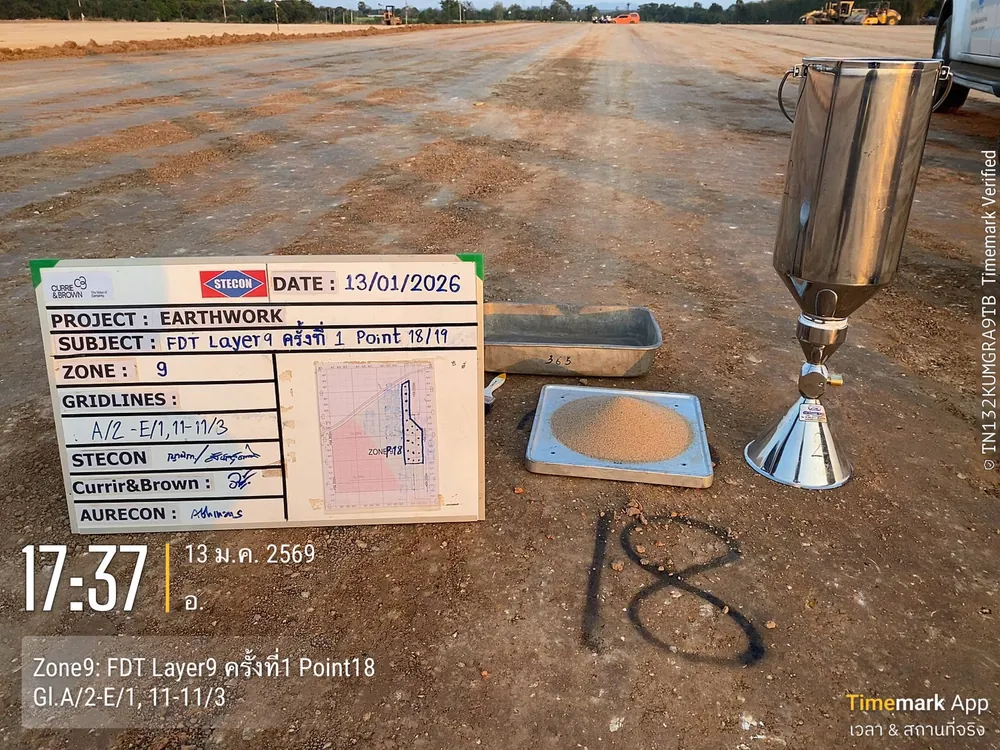
Sand Cone Field Density Test set ready on a compacted earthwork layer — standard sand jar, cone, calibrated sand tray and a board recording the zone and test point, by the SPN team
Density testing of compacted layers on a large earthwork project — tested layer by layer according to the quality control plan, with test points marked on the ground (Photo: SPN Soil Engineering)
  1. Level the compacted surface and place the base plate
  2. Excavate the test hole through the base plate opening, collect all the excavated soil, and weigh the wet soil
  3. Invert the sand cone apparatus (filled with calibrated standard sand) over the hole and let the sand flow until the hole is full
  4. Calculate the hole volume from the mass of sand that flowed into the hole (deducting the sand retained in the cone and base plate per the calibration) ÷ the sand density
  5. Oven-dry the soil sample to determine the moisture content, then calculate the in-place dry density
  6. Compare with ρd,max from the Proctor test to obtain the percent compaction, then prepare the report

The figure below summarizes the whole procedure in one view, from standard sand filling the hole in the field, through four calculation steps, to reading the result on the compaction curve, which also shows how the Standard and Modified Proctor give different reference values.

Section of a Sand Cone Field Density Test, the calculation sequence for dry density and percent compaction, and a conceptual Proctor compaction curve Three-panel diagram. The left panel is a section through compacted fill in layers: the top layer is the layer under acceptance, and the two lower layers have already been accepted. The Sand Cone set to ASTM D1556 or AASHTO T191 consists of a jar of density-calibrated standard sand, a valve, a cone and a base plate resting on the compacted surface. Below the base plate is the test hole filled by the standard sand. The hole depth is about equal to the thickness of the layer under acceptance and must not penetrate into the layer below. All soil excavated from the hole is placed in a sealed container and weighed to obtain the wet mass M, then oven-dried to find the moisture content w. The middle panel shows the four-step calculation: one, hole volume V equals the mass of sand in the hole divided by the sand density, after deducting the sand retained in the cone; two, wet density equals M divided by V; three, dry density equals wet density divided by one plus w; four, percent compaction R equals the field dry density divided by the maximum dry density from the Proctor, times one hundred. The right panel is a conceptual compaction curve with hypothetical values: the horizontal axis is moisture content and the vertical axis is dry density, with a Standard Proctor curve per ASTM D698 and a Modified Proctor curve per ASTM D1557; the Modified curve peaks higher at a lower moisture content. A dashed zero-air-voids line lies to the right of both curves. The maximum dry density and OMC are marked on the Standard curve. A horizontal dashed line marks 95 percent of the maximum dry density; field test points above the line pass and those below fail, with a note that the reference must be stated as Standard or Modified. 2D section: Sand Cone → dry density → % compaction Not to scale On site: Sand Cone ASTM D1556 / AASHTO T191 Standard sand jar Calibrated sand Valve Cone Base plate Layer tested Latest lift Sand fill Accepted layer Accepted layer Do not dig into layer below Hole depth ≈ tested layer thickness Weigh wet soil M Sealed container Oven-dry for w Convert to ρd Calculation steps 1 Hole volume V = Msand in hole ρsand Net of sand left in cone 2 Wet density ρ = M V M = wet soil mass 3 Dry density ρd = ρ 1 + w w from oven (decimal) 4 % compaction R = ρd ρd,max × 100% ρd,max from Proctor Compaction curve (Proctor) Conceptual / hypothetical values Dry density ρd → Moisture w (%) → ρd,max OMC 95% ρd,max Pass Fail Modified ASTM D1557 Standard ASTM D698 ZAV 100% saturation ⚠ State Standard or Modified
Principle of the Sand Cone Field Density Test — the hole volume is found with standard sand, dry density is calculated from the wet soil mass and moisture content, then compared with ρd,max from the Proctor test to obtain percent compaction; the test hole must not extend deeper than the layer being accepted (Diagram: SPN Soil Engineering)
Close-up of a Field Density Test hole excavated through the steel base plate opening, showing the hole measured with a tape measure and steel ruler
Test hole excavated through the base plate opening — the hole walls and bottom must be undisturbed for an accurate volume
SPN staff measuring the depth of a Sand Cone test hole with a tape measure while collecting the excavated soil for weighing and moisture determination
Checking the hole and collecting all excavated soil for weighing and oven-drying
SPN staff measuring the depth of a Field Density Test hole in compacted fill layer 20, with a board recording the compacted layer and test point
The test hole depth must match the thickness of the compacted layer being accepted — if the hole penetrates into the previously compacted layer below, the result will not represent the density of the layer tested (Photo: SPN Soil Engineering)

What Percent Compaction Is Required to Pass?

Typical criteria in Thai construction, by type of work and reference Proctor:

← Scroll to see the full table →

Type of workReference ProctorTypical required % compaction
General leveling fill (non-structural)Standard (ASTM D698)≥ 90–95%
Road embankment / fill (Embankment)Standard (ASTM D698)≥ 95%
Fill under foundations / factory floorsModified (ASTM D1557)≥ 95%
Natural subgrade (Subgrade)Modified (ASTM D1557)≥ 95%
Subbase — laterite/selected materialModified (ASTM D1557)≥ 95%
Base — crushed rockModified (ASTM D1557)≥ 95–100%
✅ Key point

The figures in the table are ranges commonly found in practice; actual values must follow the designer's requirements and the project specifications, and must state clearly whether they refer to the Standard or Modified Proctor, because ρd,max differs significantly between the two — mixing them up immediately gives the wrong % compaction

What Causes Errors in Test Results?

  • Standard sand not calibrated or damp — gives the wrong hole volume, directly affecting the density
  • Disturbed hole walls or bottom — falling soil or an irregular hole distorts the volume
  • Incorrect moisture content — gives the wrong conversion to dry density
  • Wrong Proctor type — swapping Standard and Modified gives the wrong % compaction
  • Nuclear gauge affected by gravel or high moisture — may need correction against the reference method (Sand Cone)
Drying soil samples from a Field Density Test hole in the field to determine moisture content and convert wet density to dry density
Determining the moisture content of soil excavated from the hole — even a small moisture error changes the dry density and percent compaction for the whole point (Photo: SPN Soil Engineering)

If results fall short of the criteria, track down the cause before ordering removal and rework. Read more in Field Density Test Failed? Causes and On-Site Fixes

Field Density Tests are often performed together with other soil tests for complete quality control of construction:

  • Proctor / CBR — determine the reference density and bearing capacity of pavement layer materials
  • DCP Test — a quick in-place penetration test to evaluate the strength of compacted soil/pavement layers, used alongside percent compaction results
  • Plate Bearing Test — determines the bearing capacity and modulus of subgrade reaction (k) of the compacted layer
  • Soil investigation — provides soil layer data for foundation design

Examples of Real Field Testing

SPN Soil Engineering performs Field Density Tests on many types of real projects across Thailand, including land filling, sports grounds, roads and structural earthworks, recording project details, test points and coordinates for every point so that reports are traceable:

On real earthworks, a Field Density Test is not a one-off: each layer must be accepted before the next is placed, following the sequence shown in this figure.

3D model of layer-by-layer acceptance of compacted fill with Field Density Tests Conceptual 3D view of a compacted fill platform on natural ground. The front face is cut in steps to show five compacted layers in slightly different soil colors, and the right face is a section showing the thickness of each layer. The top layer is freshly placed and compacted, with a vibratory steel-drum roller compacting it. Orange flag pins mark several test points. At one point a Sand Cone set — sand jar, cone and base plate — is set up with a technician standing beside it and a board recording the layer and point number. The edges of all lower layers carry green check-mark flags, meaning they have been accepted. A panel on the right summarizes the sequence: one, place and compact layer by layer to the thickness in the specification; two, perform Field Density Tests on every layer at the frequency in the specification; three, place the next layer only after passing, and if a layer fails, find the cause, fix it and retest; four, record the layer, location and coordinates of every point. A note states that percent compaction criteria follow the project specifications and that the image is conceptual. 3D model: layer-by-layer fill acceptance Not to scale 1 Vibratory roller Place & compact per layer Layer tested Top layer, latest lift 2 Sand Cone At orange flag 4 Record board Layer · pt · XY 3 Accepted layer Pass → place next layer Layer acceptance steps 1 Place & compact per layer To specified thickness 2 Field Density on each layer At specified frequency 3 Pass → place next layer Fail → find cause, fix and retest 4 Record layer, location and coords of each point % compaction criteria per project specification Conceptual
Conceptual 3D model of layer-by-layer acceptance of compacted fill — place and compact the top layer, perform Field Density Tests at the marked points, place the next layer only after passing, and record the layer, location and coordinates of every point (Diagram: SPN Soil Engineering)
Assembled Sand Cone set on the base plate over a test hole in a compacted fill area, with a board recording the project, compacted layer and test point number, by the SPN team
Sand Cone test set up on a real site — the project, compacted layer and location of every test point are recorded for traceability
Field Density Test by the Sand Cone method on a Bangkok construction site, with a board recording the project and GPS coordinates confirming the test point location
Testing on a Bangkok construction site — test point coordinates are recorded for traceability
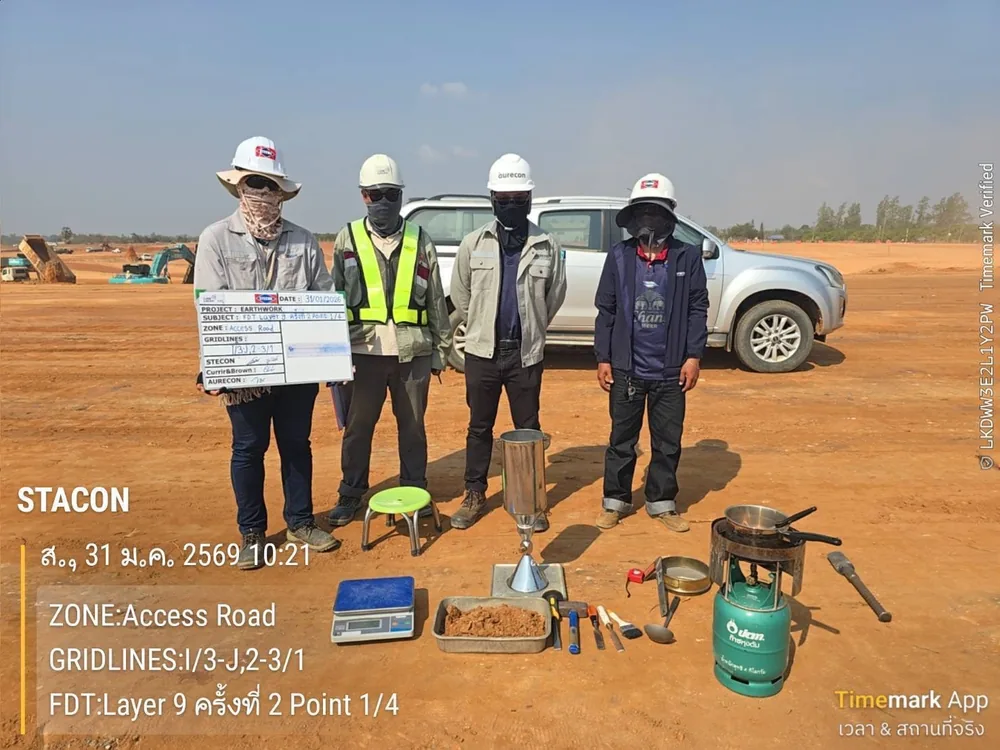
SPN team with a complete Field Density Test equipment set — sand jar, standard cone, base plate and scale — on compacted fill for a project access road
Equipment and test team on compacted fill for a project access road — a complete set of equipment and calibrated sand are the first conditions for reliable test results (Photo: SPN Soil Engineering)
📌 Note

This article is provided as engineering knowledge. The choice of test method, test point frequency and acceptance criteria should follow the project specifications and the judgment of a licensed engineer.