What Is KPT?
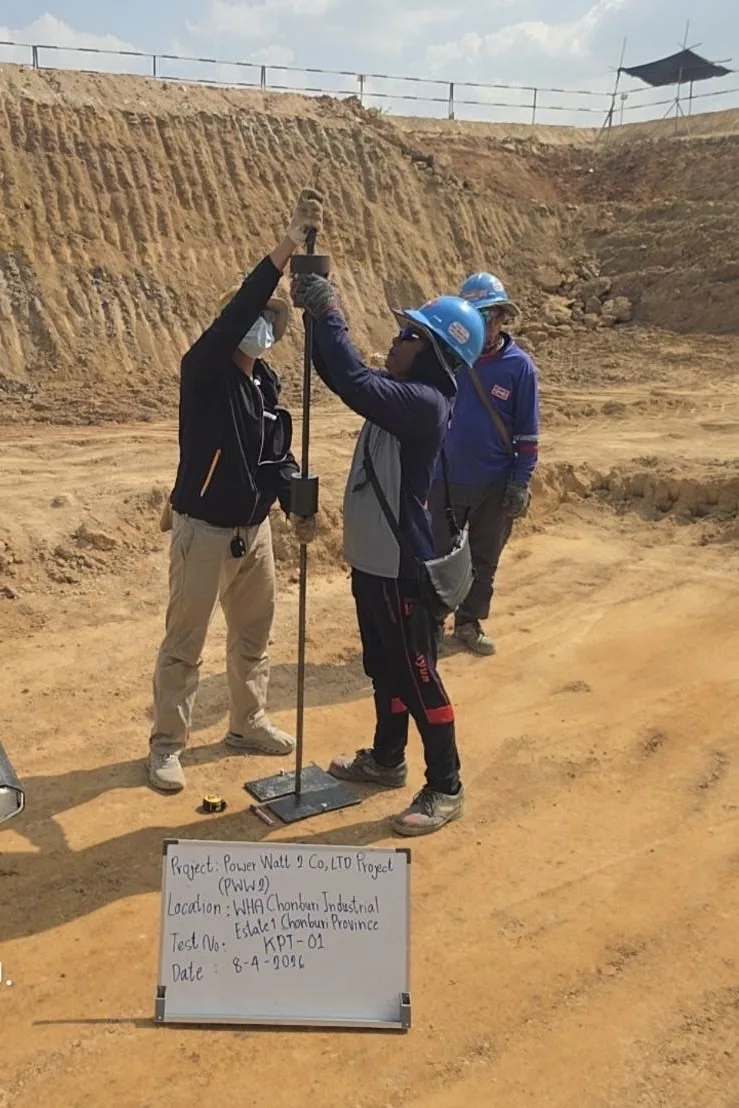
The Kunzelstab Penetration Test (KPT) is a light dynamic penetration soil test in which a hammer is dropped freely from a fixed height onto an anvil, repeatedly, to drive a steel cone tip into the ground, and the number of blows (blow count) for every 20 centimeters of penetration is recorded. The result is called N/20 cm.
Because the cone tip is larger than the drive rod, it reduces friction along the rod, so the measured value mainly reflects the resistance at the cone tip. This N value is used to assess the soil's bearing capacity and the thickness of soft and stiff layers without a drilling rig, which is why it is popular in Thailand for shallow foundations of houses and small buildings and for preliminary soil surveys.
Stiff soil → cone penetrates with difficulty → many blows → high N value → high bearing capacity | Soft soil → cone penetrates easily → few blows → low N value → low bearing capacity
Why Run a KPT, and What Are the Benefits?
← Scroll to see the full table →
| Benefit | Details |
|---|---|
| Assess bearing capacity | Calculate a preliminary allowable bearing capacity (Qa) for shallow foundation design |
| Find soft-layer thickness | Identify the depth where soil changes from a soft to a stiff layer from the N–depth plot |
| Survey across the whole plot | Test many points on a limited budget and map soil uniformity before deciding on actual boreholes |
| Reach difficult sites | Portable equipment with no drilling rig, suited to tight spaces, narrow alleys or areas vehicles cannot reach |
KPT's main strength is that it can probe many points across a plot on a limited budget, showing that the stiff layer lies at different depths at different locations before the foundation level is decided, as in the model below.
What Does a KPT Rig Consist Of?
A standard KPT rig consists of the following main parts:
← Scroll to see the full table →
| Component | Typical specification |
|---|---|
| Hammer | 10 kg |
| Drop height | 50 cm (500 mm) |
| Cone tip | Steel cone with a base larger than the rod, to reduce friction along the rod |
| Drive rod | Sectional steel rods that can be extended for greater depth |
| Recorded value | Number of blows (blow count) per 20 cm of penetration |
| Energy per blow (theoretical) | ≈ 49 J (10 kg × 9.81 m/s² × 0.5 m) — close to a DCP with an 8 kg hammer (≈ 45 J), but about 10 times lower than SPT |
KPT belongs to the light dynamic probing group, originally covered by the German standard DIN 4094 and now superseded by DIN EN ISO 22476-2 (Dynamic Probing). The light DPL rig in that standard uses a 10 kg hammer dropped 50 cm, the same as KPT, but counts blows per 10 cm, whereas the KPT used in Thailand counts per 20 cm and its cone size follows the manufacturer. The numbers therefore should not be compared directly.
How Is a KPT Performed?
- Set up plumb — place the cone tip at the test point, align the rod perpendicular to the ground surface, and check that the rod joints and anvil are tightened
- Lift and drop the hammer freely — lift the 10 kg hammer to the 50 cm drop height and let it fall freely onto the anvil, repeatedly (do not push down)
- Count blows per 20 cm — record the number of blows needed to drive the cone each 20 centimeters, as N/20 cm, over the full depth
- Add rods as it goes deeper — when the rod has sunk close to the ground surface, attach the next rod section and continue testing
- Stop and summarize — stop at the required depth or when the refusal criterion is reached, then plot the results and calculate bearing capacity
Stop the test when the cone barely penetrates under driving (e.g. more than 50–100 blows per 20 cm), which indicates a stiff layer or a dense sand/gravel layer — in the real example below, the test stopped at N = 100 blows/20 cm at a depth of 2.4 meters.
The figure below sums up the whole test in one image — a 10 kg hammer dropped freely through 50 cm drives the cone tip into the ground, blows are counted every 20 cm until a stiff layer is reached and the refusal criterion is met, and the N values are then plotted against depth to assess bearing capacity.
How Is Bearing Capacity Calculated from the N Value?
The N value (blows per 20 cm) can be used to estimate the allowable bearing capacity (Qa) with empirical formulas, chosen by soil type, in tonnes per square meter (t/m²):
Sand with a measured N = 21 blows/20 cm → Qa = 0.64 × (21 − 3.57) = 11.2 t/m² | For sand with N = 48 → Qa = 0.64 × (48 − 3.57) = 28.4 t/m²
N Value vs Bearing Capacity Table (Approximate)
← Scroll to see the full table →
| N (blows/20 cm) | Qa, sand (t/m²) | Qu, clay (t/m²) | Strength level |
|---|---|---|---|
| < 5 | < 1 | ~2 | Very soft |
| 10 | 4.1 | 3.7 | Soft |
| 15 | 7.3 | 5.4 | Medium |
| 20 | 10.5 | 7.1 | Medium |
| 30 | 16.9 | 10.5 | Dense/stiff |
| 50 | 29.7 | 17.3 | Very dense |
| ≥ 100 | 61.7 | 34.3 | Very stiff (refusal) |
Calculated from the formulas above — preliminary estimates only. Actual design must take into account the soil type, groundwater level and the judgment of a geotechnical engineer.
Example of Actual KPT Test Results
The example below is a KPT test report from an actual SPN project (test point KZ-1), tested from the ground surface to a depth of 2.4 meters. The report shows the blow count (N/20 cm) and the allowable bearing capacity (Qa) at each depth, with a blow count versus depth plot on the right.
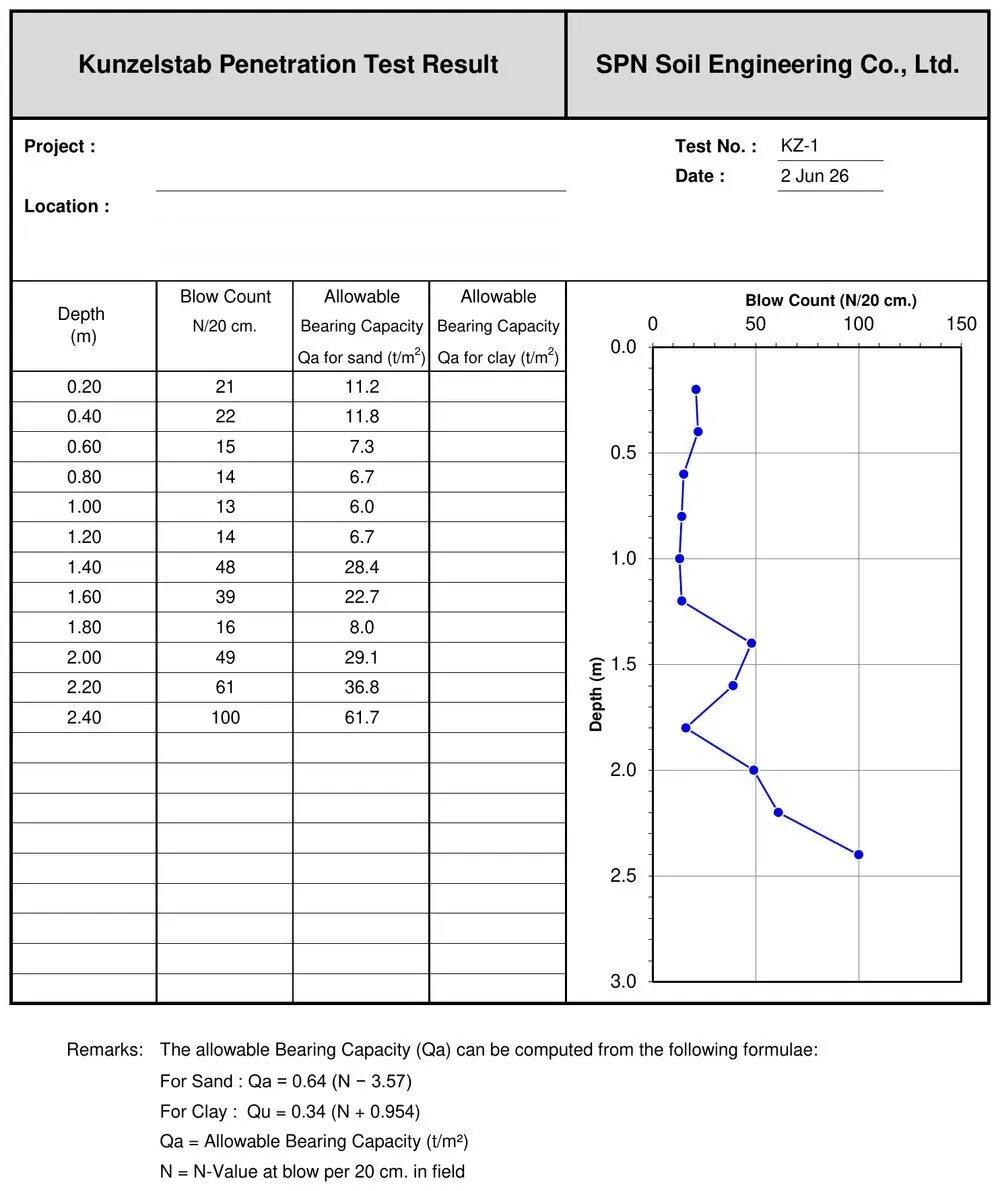
Note that from 0.2–1.2 meters N is about 13–22 blows (medium-strength soil). At 1.4 meters N jumps to 48 and keeps increasing to 100 blows at 2.4 meters, indicating a dense/stiff soil layer suitable as a foundation bearing stratum. Plotting the results this way lets the engineer choose a safe foundation level right away.
What Are the Limitations of KPT?
KPT measures only "driving resistance" and recovers no soil samples for classification, so the correct formula (sand/clay) must be chosen using nearby soil profile data or engineering judgment; otherwise the Qa value will be off.
KPT cannot identify the groundwater level, which is an important factor in foundation design. If it is needed, soil boring is required.
KPT reaches about 5 meters (7–10 meters in soft soil, but with reduced reliability), which is not enough for multi-story buildings or piles, where you need to know the pile-bearing sand layer at much greater depth. Such work requires soil boring + SPT.
Which Standards Does KPT Follow?
- DIN EN ISO 22476-2 — Geotechnical investigation and testing: Dynamic Probing, the current standard for dynamic probing, which covers the light rig (DPL) in the same family as KPT (it supersedes the former DIN 4094, a name some Thai project documents still cite)
- The bearing capacity (Qa) formulas are empirical equations used in soil surveys for shallow foundations and should be adapted to local soil conditions
Because KPT is a relative test, the resulting N and Qa values should be used together with local experience and a geotechnical engineer's interpretation.
How Is KPT Used with Other Tests?
KPT is often combined with other soil tests to give complete data for design:
- DCP vs KPT vs SPT — comparing three probing methods and choosing the right one for the job
- DCP Test — dynamic cone penetration for pavement layers and compaction quality control
- How to interpret SPT N-values — the main standard for deep foundations and piles
- Soil investigation + SPT — deep soil profile data for foundation and pile design
This article is provided as engineering knowledge. The choice of test method, number of points and interpretation of results should follow the project requirements and the judgment of a licensed engineer.