On a deep excavation in soft soil, there is one question everyone wants answered at all times: "How far has the wall moved?" An inclinometer answers it in terms of both the magnitude and the shape of the movement with depth. This case study comes from a real job SPN carried out on a construction project at Bang Phli, an area with thick soft clay where the excavation used sheet piles as the earth-retaining system. The article covers the installation steps, how to read the plots and lessons from the site. If you are not yet familiar with how the instrument works, read the basics first in What Is an Inclinometer?
What Was the Brief for This Job?
The brief was to monitor lateral movement of the soil behind the sheet pile line throughout excavation. The project was a deep excavation for an underground structure, using steel sheet piles as the retaining wall together with a strut system. With other construction and live roads around the site, the designer specified an inclinometer with alarm levels that must be reported immediately when readings approach them. For the pros and cons of sheet piles compared with other wall types, see 7 Types of Retaining Walls
The challenge at this site is Bangkok soft clay, which around Bang Phli is often many meters thick before reaching the stiff clay and sand layers. Soft clay has low shear strength: when soil is removed on one side, the earth pressure on the other side pushes the sheet piles toward the pit, and the soil behind the wall moves with them. Read more about this stratum in Bangkok Soft Clay and Foundations, and for an overview of what a deep excavation needs to monitor, see Deep Excavation Monitoring in Bangkok Soft Clay
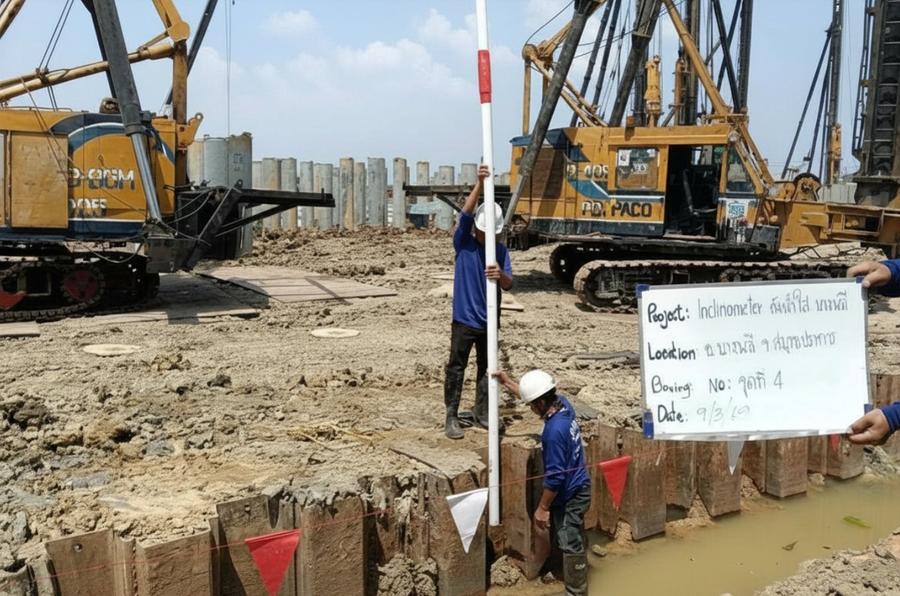
How Is the Inclinometer Casing Installed, and How Deep?
The inclinometer casing is installed in a borehole in the soil behind the sheet pile line, close enough to the wall to reflect the movement of the retaining system. For depth there is one rule: the casing toe must extend below the sheet pile toe and be embedded in a non-moving stratum. There are 4 main steps.
- Drill the borehole with the same type of rig used for soil investigation, deeper than the sheet pile toe and deep enough for the casing toe to be embedded in a non-moving stratum. The key principle is that the casing toe must sit in stiff soil or a sand layer considered stable, because the displacement of the whole column is calculated with the toe as the fixed reference. If the toe moves too, every result will be wrong.
- Lower the grooved ABS casing section by section, aligning one pair of grooves perpendicular to the wall line (A axis) so the probe's main axis picks up movement toward the excavation directly.
- Backfill the annulus between casing and borehole wall with a material that lets the casing move with the soil.
- Build the casing head and protective cover with a sign showing the borehole number, which is essential on a site where machinery runs all the time.
The measurement method follows ASTM D6230 (Monitoring Ground Movement Using Probe-Type Inclinometers), which covers installation, two-direction readings (A+ / A−) to cancel probe error, and data quality checks using the checksum.
The 3D view below places the casing in its site context. Note 3 things. First, the casing is in the soil behind the sheet pile line, not in the sheet pile itself. Second, the casing toe extends below the sheet pile toe and is embedded in stiff soil. Third, the profile lines beside the casing change shape with each excavation level and bulge most below the lower strut level. The number of strut levels and excavation levels in the figure are illustrative only.
When Are Readings Taken, and What Are They Compared With?
Every reading is compared with the baseline taken before excavation starts. After installation, the team takes at least 2–3 baseline readings on different days to confirm the casing is stable and the readings are repeatable. Every later reading is reported as the "change from baseline". A reading is taken by lowering the probe to the bottom of the casing and pulling it up 0.5 m at a time, recording the tilt at each interval, then integrating from the casing toe upward to obtain the displacement profile.
The reading schedule is tied to the excavation sequence, not the calendar. The team reads every time excavation reaches a new level, before and after each strut level is installed, and most frequently as excavation reaches formation level. The maximum value of each reading is compared with the alarm levels set by the designer from the analysis, divided into alert, alarm and stop-work levels. Read about the principle of 3-level alarm values in Deep Excavation Monitoring
How Do You Interpret the Plot, and What Does the Shape Tell You?
Interpreting an inclinometer plot means looking at 2 things together: the shape of the profile and the rate of change, not just the maximum value. Deep excavations show 3 profile shapes, summarized in the table.
← Scroll to see the full table →
| Profile shape | Meaning | Usually seen when |
|---|---|---|
| Mid-depth bulge | Normal pattern for a strutted wall; maximum displacement near formation level | Strutted excavations in soft soil; the maximum moves deeper with each excavation stage |
| Maximum at the casing head, decreasing with depth | Wall tilting as a cantilever | First excavation stage, before struts are installed |
| Whole line shifted as a block, toe not at zero | Suspect the casing toe is not embedded deep enough, or the stratum at the toe is moving too | Casing toe has not reached a stable stratum |
The second is the rate of change. Readings that step up with excavation and then stabilize are normal, but readings that keep increasing with no further excavation are a signal to increase reading frequency and notify the designer immediately. Where the struts also carry strain gauges, reading strut forces alongside the inclinometer helps confirm the system is carrying load as designed. Read more in Strain Gauges in Geotechnical Engineering
What Lessons Came from the Bang Phli Site?
This job produced 3 lessons that apply to inclinometer installation on deep excavations in general.
- Finish installation before excavation. A baseline taken after excavation has started will "swallow" the early movement, so on this job the drilling and installation were scheduled to be complete before machinery entered the pit.
- Protect the casing head. Casing heads run over by vehicles or buried by fill are a leading cause of data gaps. A steel cover and a clearly visible sign help a lot.
- Read the data as a set, not a single number. Every report must include the profile, the maximum value, and a plot of maximum versus time with the alarm lines, so the site supervisor can decide immediately without having to interpret it themselves.
If you are not sure whether your project needs a monitoring plan, see the criteria in When Is Instrumentation Required? For how retaining systems and monitoring plans are set up for deep excavations in other regions, where the soil profile differs from Bangkok, compare with Case Study: Temporary Earth Retaining System for a 4 m Deep Excavation, Khon Kaen, and see other work in the Bangkok Metropolitan Region at Soil Investigation and Pile Testing, Bangkok Metropolitan Region
Fees for instrument installation and reading depend on the type and number of instruments, installation depth and reading frequency, so they are estimated per project. Contact us for a free quotation within 24 hours. Prices exclude travel and equipment mobilization costs, which are charged extra depending on the distance to site.
Project details and photographs are from an actual SPN installation. All graphs in this article are conceptual examples showing result patterns typical of similar work, not measured values from this project, because the monitoring data belongs to the project owner. Alarm levels, instrument locations and reading frequencies must be set for each job by the design engineer based on its specific conditions.