The tool is portable, quick to use and popular both for construction acceptance inspections and for assessing existing buildings. It is one type of non-destructive structural evaluation (NDE). This article explains how it works, what it measures, its accuracy, and its limitations compared with GPR.
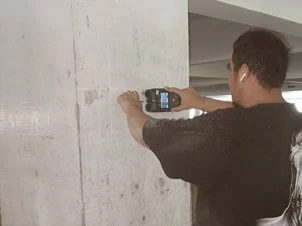
SPN engineer using a cover meter (rebar scanner) to locate rebar and measure cover on a concrete column
Scanning a concrete surface to locate rebar and measure cover — rebar locators are fast to use in the field and easy to carry

How does a cover meter work?

A cover meter works on the principle of electromagnetic induction. The probe generates a magnetic field; when it comes near reinforcing steel, which is magnetic, the field is disturbed. The instrument detects this change and converts it into the bar position and cover depth.

The shallower the bar, the stronger the signal, so the instrument estimates the concrete cover from the signal strength. As the probe is moved across the bar, the signal peaks exactly over the bar. Some models can also estimate the bar diameter when the relevant parameters are known.

2D diagram of how a cover meter works: a concrete section with rebar at different cover depths, and a graph of signal strength against probe position The upper part is a reinforced concrete section with a cover meter probe on the concrete surface. Inside the probe is a coil that generates a magnetic field, shown as blue dashed lines curving down into the concrete. When the field meets reinforcing steel it is disturbed; the instrument detects this change and converts it into bar position and cover. The section has three bars at different cover depths — shallow, medium and deep — and two closely spaced bars. Dimension lines show the cover c from the concrete surface to the bar surface and the spacing s between bar centers. The lower part is a conceptual graph of signal strength as the probe moves along the surface, using the same horizontal axis as the section. The shallow bar gives a high, sharp peak; the medium-depth bar a lower peak; the deep bar a low, broad peak that is hard to read; and the two closely spaced bars give overlapping peaks that merge into one and cannot be separated. The peak position is the bar position, and the peak strength is used to estimate cover. The bottom strip summarizes that the instrument detects only steel and cannot see voids or non-metallic ducts, is accurate at shallow depths, and should be calibrated against a bar of known size before values are used. The graph is conceptual, not measured data. Cover meter principle: magnetic field & signal peaks (2D) Not to scale A · Section Slide probe along surface Move probe Cover c Spacing s Deep bar Close bars 1 Probe emits magnetic field Blue dashes = field spreading into the concrete 2 Rebar disturbs the field Meter detects the change and converts it to bar position and cover B · Signal vs probe position Conceptual, not real data Signal strength → Probe position (same axis as section A) Shallow: high, sharp Deeper: lower peak Very deep: low, broad Close: merge into one 3 Peak = bar position Peak-to-peak = spacing s Shallower = stronger signal so cover c can be estimated 4 Deep or dense: may err Fields of adjacent bars overlap; hard to separate 1 Detects steel only No voids / non-metal ducts 2 Accurate when shallow Deep or dense: errors 3 Calibrate before use on a bar of known size
2D diagram — the signal peak sits over the bar; a shallow bar gives a high, sharp peak, a deep bar a low, broad peak, and closely spaced bars give overlapping peaks that merge into one (conceptual graph, not real data).

What can a cover meter measure?

It measures 4 things: bar position, cover, spacing and approximate bar size.

  • Position of reinforcement in both horizontal and vertical directions
  • Concrete cover compared with the drawings
  • Bar spacing, to check it matches the drawings
  • Estimated bar diameter (on some models/under some conditions)
3D model of a cover meter scanning a concrete column, with the upper concrete cover cut away to show vertical bars and ties, and chalk lines marking the detected bars on the lower part Conceptual 3D view of a square reinforced concrete column. The upper part has the concrete cover cut away to show the reinforcement cage: vertical main bars and horizontal ties wrapped around them at intervals. The cut edge shows the cover thickness c, measured from the concrete surface to the bar surface. The lower part still has an intact concrete surface, with a cover meter probe held against the left face. On the surface, vertical orange chalk lines mark the main bars and horizontal blue lines mark the ties, with a dimension line showing spacing s between two ties. A small inset at bottom left simulates the instrument screen showing a cover of 32 mm and an estimated bar size of 16 mm, both illustrative values. The right panel summarizes the four things a cover meter measures — bar position, cover, spacing and approximate bar size on some models — with three tips for reliable results: calibrate against a bar of known size, confirm critical points by chipping a little concrete, and use GPR to help where reinforcement is dense or deep. 3D model: scanning a column with a cover meter Not to scale s Main bar Cover cut away to show Cover c Concrete face to bar face Cover meter probe Move across the bars Tie Wraps main bars Orange chalk line Main bar found Blue dashes Tie line s = spacing Screen (illustrative) Cover c = 32 mm Bar size approx. Ø 16 mm Closer to the bar, higher signal bar Upper cover cut away for explanation · real scans don't damage the surface · conceptual image What a cover meter measures 1 Bar position Vertical and horizontal 2 Cover c Compared with drawings 3 Spacing s Matches drawings? 4 Approx. bar size Some models / conditions For reliable results Calibrate before measuring on a bar of known size Confirm critical points Chip a little concrete Dense / deep rebar Add GPR to help Reference guidance BS 1881-204 · DPT 1505-51
3D model — the upper part has the column surface cut away to show main bars, ties and cover c; the lower part shows chalk lines marking the detected bars. Screen values are illustrative; real work does not damage the concrete surface.

Checking cover matters for durability, because too little cover exposes the steel to early corrosion, especially in buildings in corrosive environments. Cover values are therefore often used together with Carbonation Depth Test results to see whether the carbonation front has approached the steel surface.

💡 Why cover matters

Concrete cover is the first line of defense that keeps moisture and chlorides from reaching the steel. Adequate cover per the drawings and standards therefore extends the life of the structure and reduces the risk of rebar corrosion.
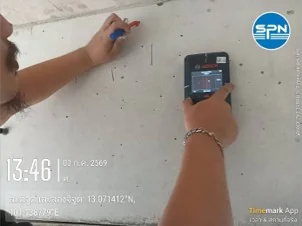
Cover meter screen showing rebar positions while marking the concrete surface
Example scan result — the instrument shows bar positions and cover values for the engineer to compare with the construction drawings and standards
SPN technician using a rebar scanner to locate reinforcement on a real building's concrete floor
Scanning for rebar on a building floor with a rebar scanner — slide the instrument over the concrete and read the values on the screen immediately

How accurate is a cover meter?

A cover meter gives accurate cover readings at shallow depths (typically from a few tens of millimeters up to about 100–200 mm, depending on the model), but accuracy drops when bars are deep or so closely spaced that their magnetic fields overlap. Where there are two layers of steel or dense crossing bars, readings can be off.

For reliable results, calibrate the instrument against a bar of known size, and at critical points chip a little concrete to confirm, or use GPR concrete scanning to help where reinforcement is dense and deep.

Cover meter or GPR: which should you use?

Choose a cover meter when you need cover and the position of the outer rebar layer quickly; choose GPR when you need to see deeper or there are non-metallic embedded objects. The table below compares the two methods point by point.

← Scroll to see the full table →

TopicCover MeterGPR
PrincipleElectromagnetic fieldRadar waves
Rebar detectionAccurate at shallow depthReaches deeper
Detects voids/non-metallic ductsNoYes
Spot cover measurementVery well suitedPossible, but needs image interpretation
Speed/portabilityFast, lightRequires scan passes
StandardBS 1881-204 · DPT 1505-51ASTM D6432 · DPT 1507-51

A cover meter detects only steel, so it cannot see voids or non-metallic ducts. Engineers often use the two methods together, and if the steel is suspected to have started corroding, follow up with Half-Cell Potential, which directly assesses the probability of rebar corrosion.

SPN engineering team in hard hats scanning for rebar on a concrete floor on a real site
SPN team scanning rebar positions on a real site — fast, non-destructive to the concrete surface, with results on the spot
⚠️ Calibrate before trusting the readings

Cover meter readings depend on the bar size and the density of reinforcement in the area. Calibrating the instrument against a bar of known size before measuring, and confirming critical points by chipping a little concrete, make the results much more reliable.

SPN Soil Engineering provides rebar scanning and cover measurement nationwide. Reports are certified by a civil engineer licensed by the Council of Engineers Thailand (COE), with signature and registration number. Contact us for a free quote within 24 hours.