Groundwater level monitoring looks simple — drill a hole, insert a pipe and lower a tape — but most mistakes are made at the stage of choosing what to install, because an Observation Well and a Piezometer answer different questions. This case study draws on a job where SPN installed both types in Samut Prakan, a low-lying soft clay area with a shallow groundwater table that changes with the seasons. For the basics of each instrument, read What Is a Piezometer? and Observation Wells for Groundwater Level Monitoring
What Was the Brief for This Job?
The objective of this job was to collect continuous monthly groundwater level data for the project's monitoring program and as baseline reference data before and during construction activities in the area. The designer specified 2 instruments: first, a Monitoring Well (Observation Well) for the overall groundwater level; second, a Standpipe Piezometer with its intake at 8 m depth for the pressure level in the clay zone of interest.
This type of monitoring is common in projects that must report on environmental matters and in projects concerned about the effect of groundwater drawdown on adjacent buildings; read the principles in Groundwater Level and Its Effects on Foundations
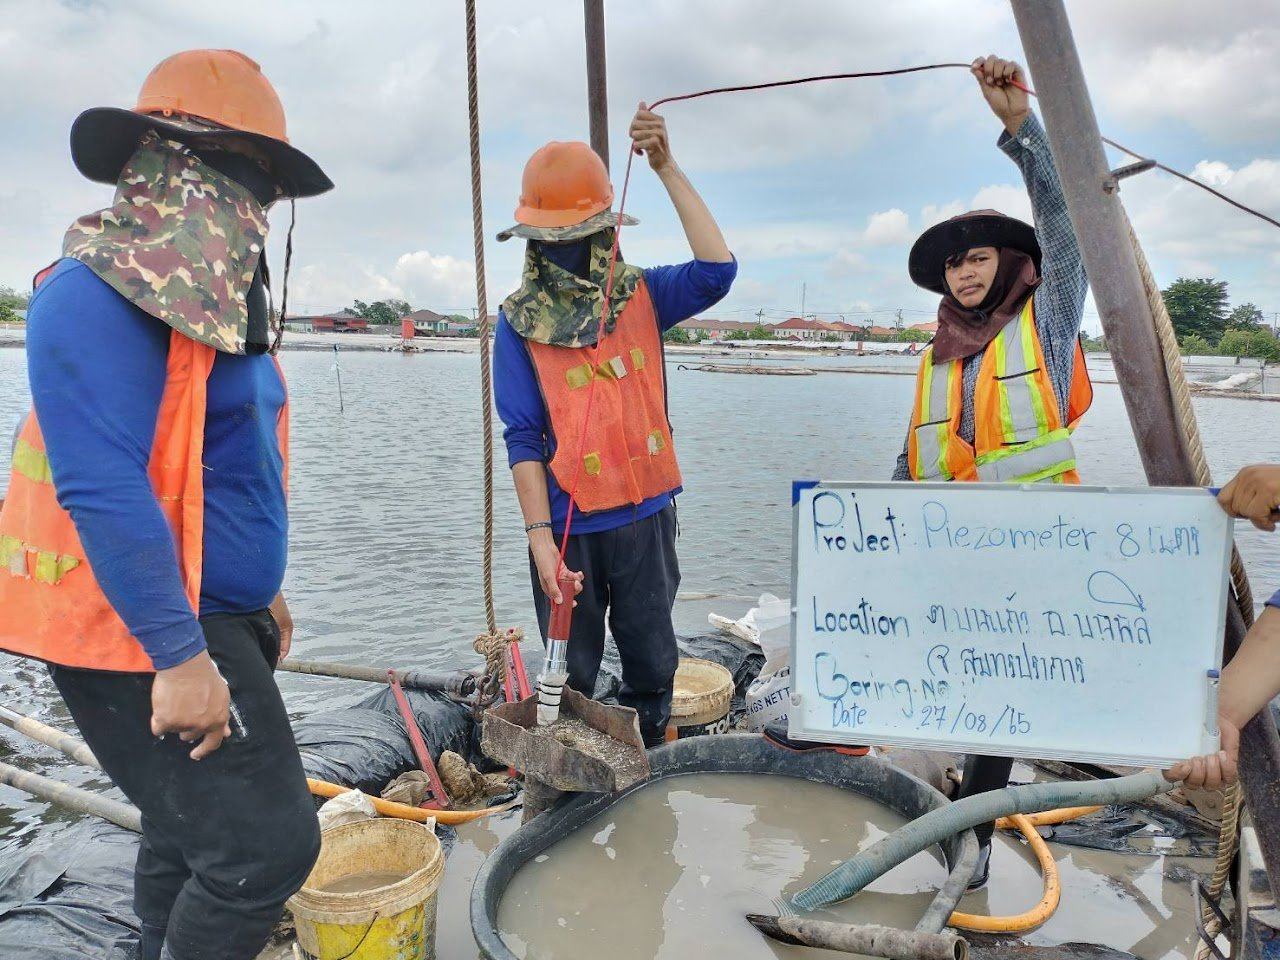
How Do a Monitoring Well and a Piezometer Differ, and Why Install Both?
A Monitoring Well and a Piezometer differ in the section of pipe open to water. Both are pipes in a borehole into which a tape is lowered to read the water level, but a Monitoring Well has a screen along nearly its full depth, so water from every layer can flow in, and the level read is the overall groundwater level.
A Standpipe Piezometer has a short screen only at the tip, surrounded by filter sand and sealed with bentonite above the filter zone to prevent water from other layers flowing down. The level read is the piezometric level of the soil layer at the tip only.
← Scroll to see the full table →
| Topic | Monitoring Well (Observation Well) | Standpipe Piezometer 8 m |
|---|---|---|
| Intake zone | Screen along nearly the full depth | Short screen at the tip, at 8 m |
| Backfill/seal | Filter sand around the pipe, sealed at the top only | Filter sand around the filter zone + bentonite seal above + backfill to ground surface |
| Reading obtained | Overall groundwater level | Pore pressure level in the soil layer at the tip |
| Response | Fast, following seasons and surface activities | Slower, because clay has low permeability; narrower fluctuation range |
| Used for | Monthly groundwater level reporting, water sampling | Assessing pore water pressure in soil layers for foundations, deep excavations and stability |
The reason for installing both is the difference between the two readings. If the pressure level at 8 m is lower than the overall groundwater level, water tends to flow downward, for example because of pumping from deeper layers in the area. If it is higher, there is upward pressure from the layers below. This information matters for deep excavations and foundations, and a single reading from a single pipe cannot tell you this.
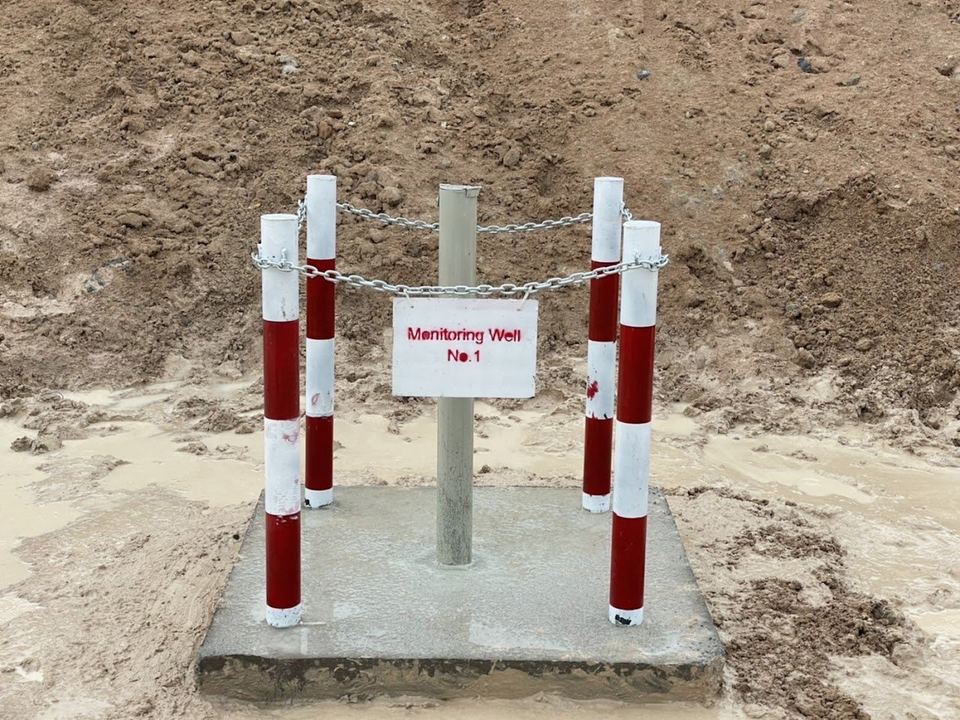
The conceptual image below brings the site context together in one view. Look at 3 points: first, Monitoring Well No.1 with its screen along nearly the full depth; second, the Standpipe Piezometer open to water only at its tip at 8 m depth; third, reading with a Water Level Meter from the pipe top. Water levels in the image are drawn for explanation only and are not project measurements.
How Was It Installed, and What Commonly Goes Wrong?
Installing the 8 m Piezometer involves 5 steps: drilling, lowering the pipe, placing filter sand, the bentonite seal, and finally backfilling and finishing the wellhead.
- Drill the hole to the target depth and log the soil layers while drilling, to confirm that the tip is actually in the intended layer.
- Lower the pipe with a short screen at the tip.
- Place filter sand around the filter zone.
- Place bentonite pellets above the filter zone to a sufficient thickness and allow them to swell.
- Backfill the rest of the hole, then finish the pipe top with a lockable cap.
The Monitoring Well uses a long screen with filter sand around the pipe along its full length, sealed only at the top, then finished with a concrete base, bollards and a number sign.
There are 3 common mistakes:
- Poorly placed bentonite seal: water from upper layers leaks down, and the Piezometer unknowingly becomes an Observation Well.
- No flushing after installation (well development): sediment clogs the screen, so readings respond abnormally slowly.
- No wellhead protection in areas with vehicles and workers, which is the main cause of data gaps in long-term monitoring.
For Vibrating Wire Piezometers used for automatic readings, acceptance testing of the sensors before installation refers to ASTM D7764.
How Were Readings Taken and Interpreted Seasonally?
Both types are read with a Water Level Meter, a measuring tape with a water-sensing probe and length graduations. It is lowered into the pipe until it signals, then the depth is read from the pipe top and converted to a common datum for every well, using the surveyed pipe-top elevation.
Each reading round must record the date and time, weather and site activities such as rain, pumping and excavation, because these explain the changes in the graph.
The pattern found in low-lying soft clay areas is that the water level in the observation well rises in the rainy season and falls in the dry season, while the Piezometer in the clay layer responds more slowly and fluctuates less. Interpretation therefore looks at 2 things: first, the long-term trend compared with the previous year, not isolated monthly values; second, sudden changes that do not match the season, which are often related to construction activities or pumping. Such values must be reported to the designer immediately.
What Lessons Came from the Samut Prakan Job?
This job offers 3 lessons: choose the instrument type to match the question, log the soil layers every time you drill, and collect a baseline that covers all seasons.
- Choose the type to match the question. If the question is "how deep is the groundwater?", use a Monitoring Well. If the question is "what is the water pressure in the soil layer that will support the foundation or be excavated?", you need a Piezometer. Most projects need both.
- Log the soil layers every time you drill. A tip depth of 8 m is only meaningful if you know which soil layer it is in.
- The baseline must cover all seasons. In areas where the water level fluctuates strongly with the seasons, a one-month baseline cannot be used to judge abnormalities, so long-term monitoring should start as long as possible before construction activities.
If the project needs continuous automatic readings instead of monthly readings, see the comparison in Manual vs Automatic Monitoring: What Is the Difference?
Fees for instrument installation and reading depend on the type and number of instruments, installation depth and reading frequency, so they are estimated per project. Contact us for a free quotation within 24 hours. Prices exclude travel and equipment mobilization costs, which are charged extra depending on the distance to site.
Project details and photographs are from an actual SPN installation. All graphs in this article are conceptual examples showing result patterns typical of similar work, not measured values from this project, because the monitoring data belongs to the project owner. Alarm levels, instrument locations and reading frequencies must be set for each job by the design engineer based on its specific conditions.