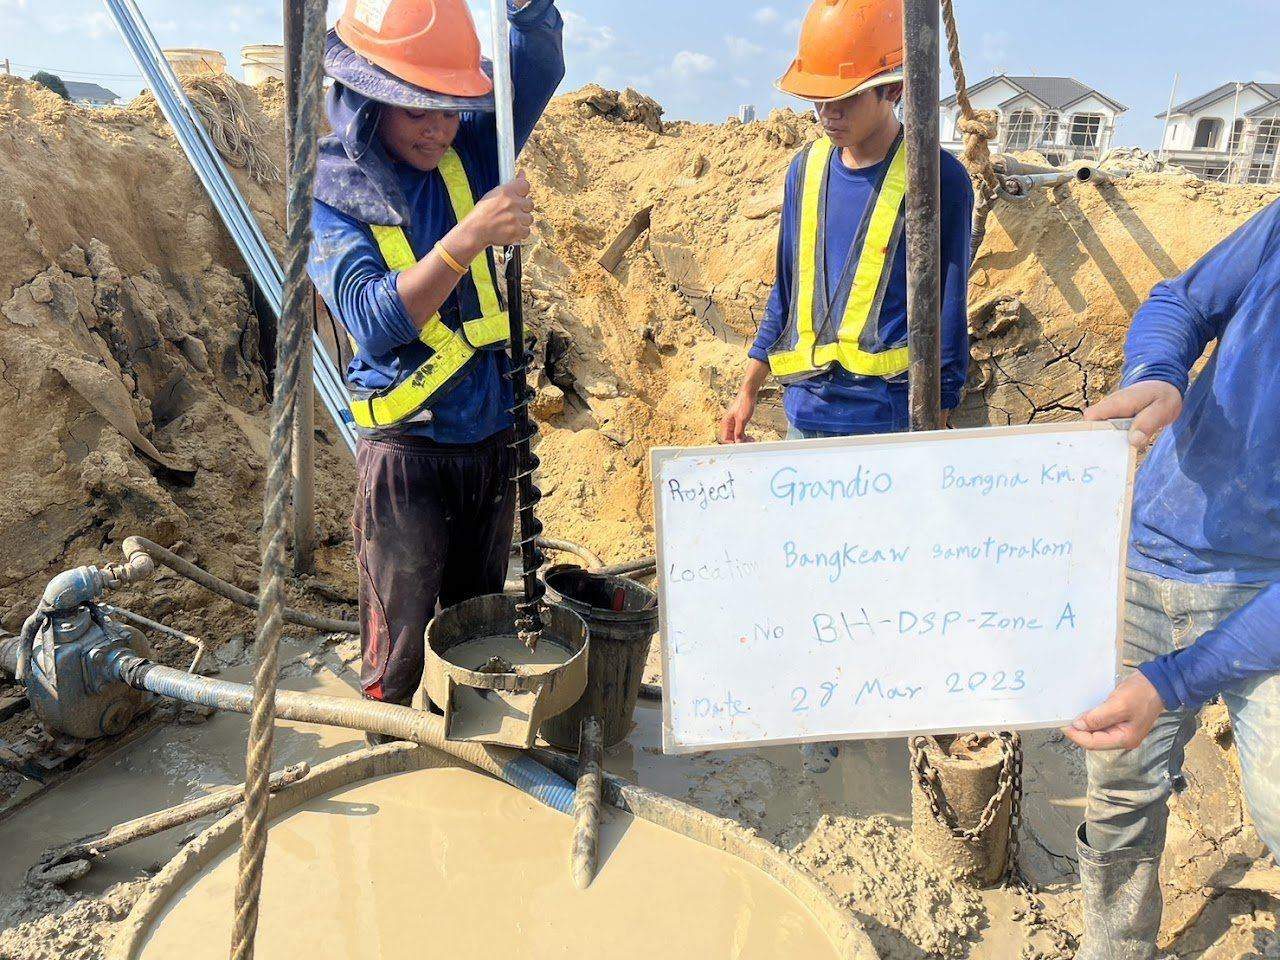
Earthworks and foundation projects on soft soil usually ask the same question: "How much more will the ground settle, and for how long?" A settlement plate tells you how much the ground surface has settled, but not which soil layer the settlement comes from. A Deep Settlement Point answers that second question. This case study is based on work SPN drilled and installed at the Grandio Bang Na Km 5 project, which sits on the thick soft clay typical of the Bang Na area.
What is a Deep Settlement Point, and how does it differ from a Settlement Plate?
A Deep Settlement Point is a measuring anchor embedded in a borehole at a specified depth, with a rod or measuring assembly extended up to the ground surface, to measure how much the soil "at that level" has settled relative to a reference benchmark. A Settlement Plate is a steel plate placed on the original ground surface before filling, so it measures the combined settlement of all layers beneath the plate. The two instruments work well together; the table below summarizes the differences.
← Scroll to see the full table →
| Topic | Settlement Plate | Deep Settlement Point |
|---|---|---|
| What it measures | Total settlement of the original ground surface | Settlement of soil at specified depths (several levels possible in one borehole) |
| How it is installed | Steel plate placed on the ground before filling, with rod extended up as fill rises | Drill a borehole, embed anchors at target levels, backfill, extend the measuring assembly to the surface |
| Question it answers | How much has it settled, and is it nearly complete? | Which layer settles most, and has the deep layer started to compress? |
| Best for | Embankments, fill, general preloading | Projects needing layer-by-layer design verification, thick soft soil, projects with PVD |
| Cost | Low | Higher because drilling is required |
Where PVDs are used to accelerate consolidation, layer-by-layer data shows whether settlement is occurring in the layers covered by the PVDs or in deeper layers, so it can be used to judge whether the ground improvement is performing as designed. Read about the principles in PVD and preloading on soft soil
Why did the Bang Na project need layer-by-layer settlement measurement?
The Bang Na project needed layer-by-layer settlement measurement because surface measurement alone cannot separate settlement from the upper soft layer and the deep clay. The Bang Na–Bang Phli area lies where Bangkok soft clay is very thick. Fill placed to raise the ground, or loads from structures resting on this layer, cause consolidation that lasts many months to years. The upper soft layer consolidates quickly, while the deep clay consolidates slowly and keeps settling long after the filling is finished.
The designer therefore specified a Deep Settlement Point, with anchors placed at the boundaries of the main soil layers based on soil investigation results. The difference between each pair of anchors then represents the compression of the layer between them and can be compared with calculated values. For settlement problems in filled ground and how to fix them, see Fill settlement: how to fix it
How is it installed, and what are the steps?
Installing a Deep Settlement Point involves 4 steps: drill the borehole, embed the anchors, backfill the hole and set up the reference point.
- Drill the borehole to the deepest anchor level, logging the soil while drilling to confirm that anchor levels match the actual layer boundaries, not just the drawings.
- Embed the anchors at the target levels and fix them so they move together with the soil at that level.
- Backfill the hole with material that does not restrain the movement of the anchors and does not become a stiff column propping them up.
- Set up the reference point: the benchmark must be outside the zone of influence of the fill and founded on a firm layer, because if the benchmark settles too, all measured values will be lower than the true values.
The 3D view below shows the components of this work in a single scene. Look for 3 things. First, each anchor is fixed to the soil at a different level in the same borehole. Second, the measuring rod of each anchor runs inside a casing pipe up to the ground surface. Third, every reading is tied to a benchmark outside the fill area. Brackets A, B and C are the soil layers between adjacent anchors. This is a conceptual illustration; the number and levels of anchors shown are examples, not the project's actual values.
Readings are taken by level survey, comparing the rod head of each anchor with the benchmark. This is done with a high-precision level in the same round as the settlement plate readings, so surface data and deep data can be compared directly. The next graph shows the pattern of results obtained from this kind of reading.
How are the results interpreted, and what do differences between anchors tell you?
Interpreting Deep Settlement Point results means checking 3 things in order: the order of the lines, the difference between adjacent lines, and the slope at the end of each line.
- Order of the lines: a shallow anchor must always settle more than or equal to a deeper anchor. If the lines cross, there is an installation problem or the benchmark has moved.
- Difference between adjacent lines is the compression of the soil layer between those two levels. The layer with the largest difference is the one responsible for most of the settlement.
- Slope at the end of each line: all lines should level off after filling stops. If a deep-layer line is still steep while the surface line has flattened, settlement will continue from the deep layer even though the surface appears stable.
This data set is used to confirm or adjust values calculated from consolidation theory, and serves as evidence for deciding when construction of structures on the filled area can begin. For details on reading settlement plates and predicting remaining settlement, see Settlement Plate: settlement monitoring for fill works
What lessons came from the Bang Na project?
The Bang Na project offers 3 lessons for Deep Settlement Point work on soft soil.
- Anchor levels must follow the actual soil layers. On this project, levels were confirmed from the soil recovered while drilling before each anchor was embedded, because actual layer boundaries can differ from those in investigation boreholes some distance away.
- The benchmark is half of the accuracy. In soft-soil areas where everything settles, choosing the benchmark location and checking it periodically is as important as the anchors themselves.
- Always read together with a settlement plate. The sum of the layer-by-layer differences should be close to the value from a nearby settlement plate. If they do not match, find the cause before using the data.
For an overview of other instruments used alongside this kind of work, see What is geotechnical instrumentation? Every type used in practice. For settlement points and tiltmeters used to monitor adjacent buildings, see Settlement Point and Tiltmeter
Fees for instrument installation and reading depend on the type and number of instruments, installation depth and reading frequency, so they are estimated per project. Contact us for a free quotation within 24 hours. Prices exclude travel and equipment mobilization costs, which are charged extra depending on the distance to site.
Project details and photographs are from an actual SPN installation. All graphs in this article are conceptual examples showing result patterns typical of similar work, not measured values from this project, because the monitoring data belongs to the project owner. Alarm levels, instrument locations and reading frequencies must be set for each job by the design engineer based on its specific conditions.